|
Introduction Coordination polymers have been noted to be a group of functional materials that have found applications in multiple processes. The study of coordination polymers has expanded rapidly in the past decade due to its suscep- tibility to attain a variety of architectures built up from an extended range of molecular building blocks with varying interactions. Coordination compounds with backbones, constructed from metal ions as connectors and ligands as linkers, have been utilized invarious processes due to their interesting characteristics [1]. Coordination networkshaving porous features have advanced nanoporous compounds for processes, whichinclude catalysis, adsorption, and gas separation, among others, due to their tunablepore sizes, large surface areas, high porosities, and good thermal and mechanical stabilities [2,3]. The study of coordination compounds involves the study of metals, which perform a variety of roles in many biological, catalytic, and materials applications and are essential parts of coordination chemistry. To harness their reactivity and fully utilize their potential in various domains, it is crucial to comprehend the behavior and characteristics of metal centers in coordination compounds[3]. Their electrical structure determines the bonding and reactivity of metal centers. Metal ions frequently display varying oxidation states which cause coordination compounds to develop with various electronic configurations [4]. The stability and spectroscopic characteristics of metal complexes are influenced by the distribution of electrons in the metal d orbitals [5]. Specific coordination geometries, such as octahedral,square planar, or tetrahedral, are adopted by metal centers in coordination complexes. These geometries are determined by the type of ligands used and the metal ion's electronic state [3]. Dyes, such as Congo red, are reportedly utilized as coloring agents for materials such as leather, textile, and paper, among others [5-7]. The reactiveness of some dyes makes them suitable for use due to their brightness and fastness when used [4,5]. These dyes, however, present the problem of toxicity and carcinogenicity when used, causing harm directly to aquatic life and humans, thus, generating conditions that include lung cancer and neurological disorders. The removal of these toxins from the environment is hindered by the structural complexity of synthetic dyes and their highly water-soluble nature [7-9]. We herein report the sorption of Congo red dye from water by a synthesized Cu(II) complex containing mixed 1,2,4,5-bezene tetra carboxylic acid (BTCA) and 4-amino-methyl benzoic acid (AMB) ligands, as adsorbents for the removal of Congo red dye from aqueous solution. The compound was successfully characterized and formulated as [Cu(BTCA)(AMB)].
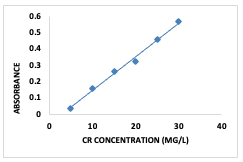
Experimental Materials and Methods The reagents used for this study were of analytical grade and used without further purification. The absorbance measurements were taken using a SHIMADZU UV-1650UV-Vis spectrophotometer. Scanning electron microscopy (SEM) was carried out usinga JEOL JSM-7600F Scanning Electron Microscope. Synthesis of the [Cu(BTCA)(AMB)] The compound was synthesized using a solvent-based method. Solutions of the ligands (BTCA and AMB; 1 mmol each) were dissolved in 10 mL each of dimethyl formamide and distilled water separately and transferred into a round-bottom flask containing the dissolved Cu2+ salt. The mixture was stirred thoroughly to ensure homogeneity and refluxed for 2 h at 120°C withconstant stirring. The precipitate formed wasthereafter isolated by filtration, washed with50:50 DMF and distilled water, dried, andstored. Batch Adsorption Studies Adsorption of Congo red (CR) dye onto[Cu(BTCA)(AMB)] was studied using a Congo red stock solution of 1000 mg/L. This was prepared by dissolving 0.25 g of theCongo red dye in 250 ml of deionized water. Absorbance of the Congo red solution was then observed using a UV-Visible spectrophotometer to obtain the wavelength of maximum absorption which was found to be 500 nm. Lower concentrations of the dye (5–30 mg/L) were prepared from the stock solution by serial dilution with deionized water and absorbance readings taken with the UV–Visible spectrophotometer at a λmax value of 500 nm [6]. The graph of absorbance against concentration was plotted to give the calibration curve (Figure 1).
The effect of concentration, temperature, time, pH, and the dose of adsorbent on theadsorption process was investigated. To determine the quantity adsorbed (qe in mg/g) at equilibrium, equation 1 was utilized: where Co and Ce (mg/L) are the initial and final concentrations of the adsorbates, respectively, v is the volume of the solutionused (L), and m is the mass (g) of the adsorbents.The effect of concentration was studied using 5–30 mg/L of the adsorbate, while the effect of temperature was studied at the temperature range of 30–70°C. The effect of pH was investigated by varying the pH between 2 and 13 using 0.1 M HCl or 0.1 M NaOH, while the effect of adsorbent dosage was studied using 0.01–0.05 g of the adsorbents, and the investigation of effect of time was done at time interval of 60–300 min [7].
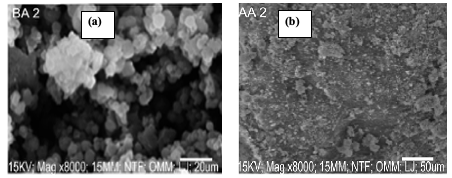
Result and Discussion Result of SEM Analysis Figure 2a and 2b depict the SEM images of[Cu(BTCA)(AMD)] before and after adsorption.
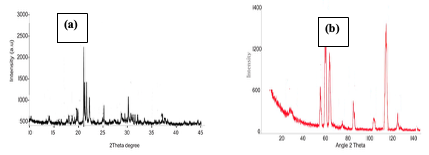
The surface morphology showed the presence of voids in-between the particles before adsorption while the image after adsorption shows the incorporation of the dye into the voids in-between the particles (Figure 2b). Result of PXRD Analysis The PXRD pattern of the [Cu(BTCA)-(AMD)] compound, before and after adsorption, are presented in Figure 3 (a and b).
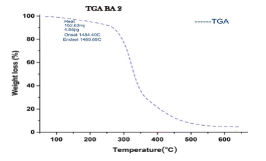
A comparison of the patterns showed a reduction in intensity of peaks generally for the PXRD pattern after adsorption of CR dye.This is attributed to the presence of the dye molecules on the adsorbent [8-10]. Result of TGA Analysis The TGA of the compound showed two stages of decomposition within a temperature range of 0–650°C [9-11]. The first stage of decomposition results to about 12% weight loss, ranging from a temperature of 0–290°C.The second decomposition stage, which starts from 290°C and ends at 500°C, results in a weight loss of 79%. Figure 4 shows the TGA curve of the sample.
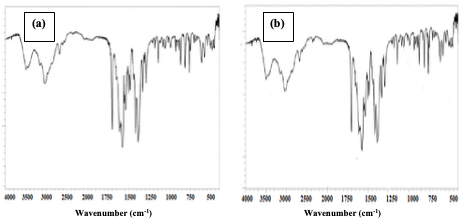
Result of FTIR Analysis Using a Shimadzu FTIR spectrophotometer,the functional groups present in the[Cu(BTCA)(AMD)] compound, before and after adsorption, were obtained by studying the spectral as shown in Figure 5. Peaks observed at 3496.99 cm-1 and 3444.96 cm-1were attributed to the presence of hydroxyl(O-H) and amino group (N-H), respectively.The peak observed at 1710 cm-1 was attributed to the carbonyl group of the carboxylate. The diagnostic region of the compound, before and after adsorption, were observed to be similar. However, the presence of the Congo red dye on the compound, after adsorption, causes a significant difference in the fingerprint region (Figure 5, a and b).
The peak observed at 732 cm-1 in the spectra after adsorption was attributed to the characteristic FTIR band of the ν(S-O) group inthe Congo red dye. This peak was observed to be absent in the spectra before adsorption study.
Adsorption Study Effect of Congo Red Dye Concentration The findings from investigating the effect of Congo red dye concentration on the adsorption process using the adsorbents is presented in Figure 6.
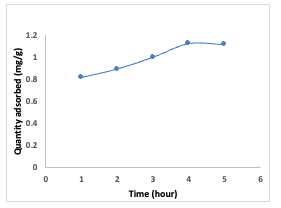
It was observed that as the concentration of the dye increased, the amount of Congo red dye adsorbed onto the adsorbents also increased, reaching its maximum at 25 mg/L. As the dye concentration increased, the adsorption sites on the adsorbents became saturated, resulting in the subsequent release of the dye as the process continued. This phenomenon occurred because there was intensified competition among Congo red dye molecules for the available adsorption sites on the adsorbent, causing an initial surge in the adsorption rate, followed by a gradual deceleration of the process. This behavior can be attributed to the fact that at lower dye concentrations, there is a higher ratio of solute to vacant adsorbent sites, leading to increased quantity adsorbed [8]. Effect of Time The impact of time on the adsorption of Congo red dye onto the [Cu(BTCA)(AMB)] material, as presented in Figure 7, suggests that as the contact time increased, the efficiency of adsorption gradually rose and reached its maximum value after 120 minutes, after which it remained constant.
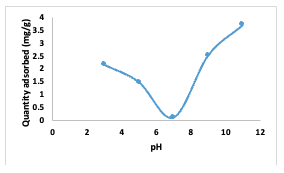
This experiment was conducted at a pH of 7.0 with a dye concentration of 25 mg/L. A dosage of 0.01 g of adsorbent was used for durations ranging from 60 to 360 minutes to determine the equilibrium time for the adsorption process. The initial increase in adsorption is attributed to the presence ofavailable adsorption sites on the materials,which gradually became occupied over time [9-12]. Effect of pH The impact of change in pH on the adsorption of Congo red dye by [Cu(BTCA)(AMB)] is presented in Figure 8. Equilibrium concentrations of dye at 25 mg/L over 240 min were employed. Adjusting the pH within the range of 2.0 to 11.0 using either 0.1 M HCl or 0.1M NaOH [9] indicated that at lower pH (between 3.0 and 6.0), sorption of Congo red dye onto [Cu(BTCA)(AMB)] decreases.
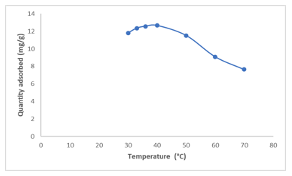
This phenomenon is attributed to an acid-base interaction between the dye molecules and the surface of the [Cu(BTCA)(AMB)]. Conversely, at higher pH values (rangingfrom 8.0 to 12.0), the Congo red dye adopts an anionic nature due to the presence of hydroxyl ions in its solution. This leads to an increased adsorption of the dye onto the surface of the adsorbent [9,13,14]. Effect of Temperature The effect of temperature change on the adsorption process was monitored using 0.01 g of the adsorbent for this study. The temperature was varied within the range of 30 to 70°C, and each experiment lasted for 4 hours.
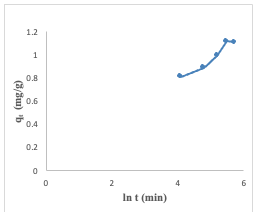
The findings presented in Figure 9 revealed that the quantity adsorbed increases after an increase in the temperature to 40°C and later decreases at a further increase in temperature.The decline in quantity adsorbed may be attributed to the increased kinetic energy acquired by the dye molecules at temperatures beyond 40°C [15-17]. Effect of Adsorbent Dose The impact of varying the dosage of adsorbents on the adsorption of Congo red dye was examined in this study (Figure 10). Specifically, a constant equilibrium dye concentration of 25 mg/L was maintained, and the study was done at a temperature of 40°C.
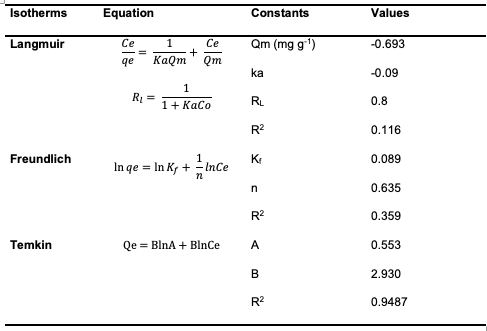
The quantity of adsorbent used in the experiment was adjusted, ranging from 0.01to 0.05 g. It was observed that as the amount of adsorbent increased, the quantity adsorbed decreased. This can be attributed to anagglomeration of the adsorbent particles due to the increased quantity of adsorbents employed [10,14,18]. Adsorption Isotherms Studies To assess the adsorption of congo red dyeover [Cu(BTCA)(AMB)], three different models, Langmuir, Freundlich, and Temkin,were employed in an effort to determine which isotherm model best describes the adsorption process [8]. The parameters obtained from subjecting the adsorption data to the various isotherm models are given in Table 1.
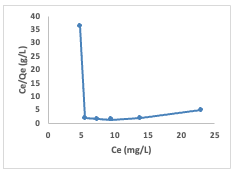
The Langmuir adsorption isotherm (equation2) was studied by plotting a graph of Ce/Qeagainst Ce (Figure 11), where Ce is the finalconcentration, and Qe is the quantity ofCongo red adsorbed.
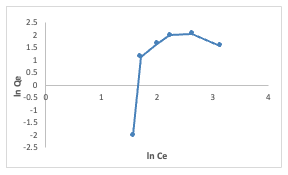
The linear form of the Langmuir isotherm model gave the values of Ka [the Langmuiradsorption constant (L/mg)] and Qm [theoretical maximum adsorption capacity(mg/g)] obtained from the intercept and slope of the plot of the graph [9]. Adsorption is speculated to be a monolayer adsorption with no interaction between the adsorbate molecules. The linear form of the Langmuir model and the equation used in calculating the separation factor (RL) (equation 3) are given in equations below: where Ka (L/mg) is the Langmuir constant, and Co (mg/L) is the initial concentration.The adsorption process can be determined as favorable when the RL value lies between 0 and 1. The Qm value was found to be -0.6922 and the constant Ka to be -0.09. The RL was calculated to be -0.8, which falls below 0 and indicates unfavorable adsorption, while theR2 value was obtained as 0.1166.The relationship of the amount adsorbed per unit mass or mole with concentration is demonstrated by the Freundlich model (equation 4) given as: The Freundlich isotherm model parameters such as the 1/n and as Kf [(mg g-1)/(mg L-1)] were obtained from the intercept and slope of the linear plot of lnQe versus ln Ce (Figure 12), respectively.
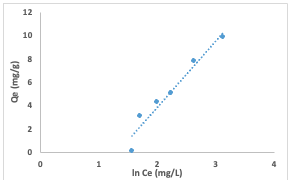
The Kf, Freundlich constant is the adsorption capacity, that is the adsorptive power, and the1/n, heterogeneity factor, indicates the energy of adsorption. The 1/n value of 1.527 obtained indicates the unfavorable adsorption of Congo red dye for adsorption onto the adsorbents, while lower R2 value of 0.359 for the adsorbents indicates that the Freundlich model less fits the experimental data. The Temkin isotherm model (equation 5) was used to estimate the heat of the adsorptionand the adsorbent–adsorbate interaction. It is evaluated using the equation given below by plotting the graph of Qe against ln Ce(Figure 13), and the constants A (g/L) and B(J/mole) corresponding to the maximal equilibrium binding energy and heat ofadsorption, respectively, were calculated using the linearized Temkin equation.
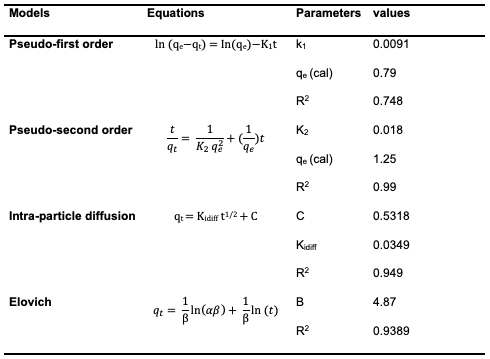
The obtained values of A and B are given as 0.553 and 2.930, respectively. The R2 value of 0.9487 obtained indicated the best-fit of the Temkin adsorption isotherm to the adsorption data obtained for uptake of Congo red dye by [Cu(BTCA)(AMB)]. This suggests the occurrence of adsorbent–adsorbate interactions in the adsorption process [16]. Adsorption Kinetics The experimental adsorption data for the adsorption of Congo red dye by[Cu(BTCA)(AMB)] was analyzed using the kinetic models of pseudo-first order, pseudo-second order, intraparticle diffusion model and Elovich diffusion model. Parameters obtained were summarized in Table 2.
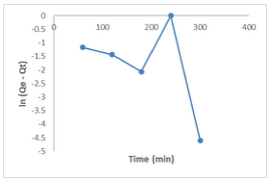
Pseudo First Order Kinetics (Lagergren Model) The Lagergren model (equation 6)parameters for the uptake of Congo red dye by the [Cu(BTCA)(AMB)] absorbent was derived by plotting ln (qe−qt) against time from the linearized form of the equation given below. Values of k1 and qe were determined from the slope and intercept. The qe value was obtained as 0.79, and k1 was obtained as 0.0091. The discrepancy between the intercept and the actual experimental Qe value signifies that this model does not accurately describe the experimental data, indicating that the adsorption rate does not conform to this equation [16].
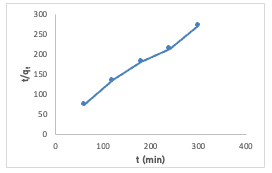
Pseudo-Second Order Kinetic Model The adsorption data for uptake experiment of Congo red dye by [Cu(BTCA)(AMB)] was analyzed using the pseudo-second-order kinetic model. A linear relationship was observed from the plot t/Qt versus t (Figure 15), exhibiting a notably strong correlation coefficient (R2) value.
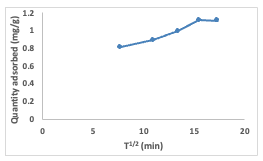
Both the equilibrium adsorption capacity(Qe) and the rate constant (k2) were computed by extracting these values from the slope and intercept, respectively. The Qe and k2 values were calculated to be 1.27 and 0.018, respectively. The pseudo-second-order model proves its applicability to the adsorption experiment due to the high correlation coefficient (R2) value of 0.99 obtained, and also indicates it best explains the adsorption process [17]. The linearized form of the pseudo-second order rate equation (7) is given as: Intraparticle Diffusion Model The intraparticle diffusion model is often represented by a plot of the amount of adsorbate adsorbed (Qt) against the square root of time (t1/2) using the equation (8) below: The values of Kdiff [the intraparticle diffusion rate constant (mg/g/min1/2)] and C (thickness of the boundary layer) were calculated from the slope and intercept of the plot of qt versus t1/2 (Figure 16) and obtained as 0.0349 and 0.5318, respectively. The R2 value was found to be 0.949 which indicates that the experimental data can be explained by the intraparticle diffusion adsorption kinetics model [15,16].
Elovich Kinetics Model The adsorption of Congo red onto the adsorbent surfaces was analyzed using the Elovich model. This model accounts for the non-linear behavior that is frequently seen during the early phases of adsorption. The Elovich equation, plot of qt against ln(t), presented a slope of (1/ β) and an intercept of(1/β) ln (αβ). The value of β was calculated to be 4.87, and α to be 0.16 (Figure 17).
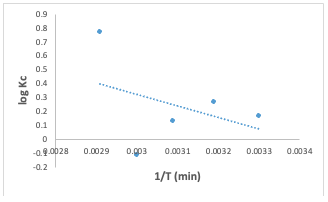
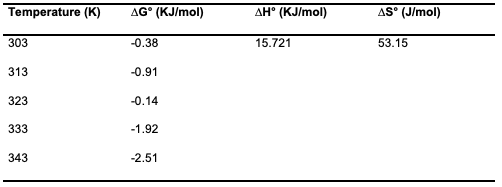
However, it's worth noting that the correlation coefficients (R2) were found to be high with a value of 0.9389, indicating that this model is suitable for an assessment of the adsorption process [17]. The linearized equation (9) for the Elovich kinetic model is given as: The data presented in Table 2 suggests that the Congo red dye adsorption experiment best-fits the pseudo-second-order kinetics with a correlation coefficient value of 0.99.This fit was superior compared to alternative kinetic models across the entire adsorption process. Consequently, it can be inferred that the pseudo-second-order equation provides a more accurate description of the adsorption kinetics of Congo red dye on the adsorbent. This suggests that occurrence of chemical interaction between the adsorbate and the adsorbent as suggested by the Temkin isotherm model earlier analyzed [14,16,18-20]. Adsorption Thermodynamics To obtain the thermodynamics data of the adsorption study of Congo red dye on the adsorbent, an investigation of thethermodynamics was done at five different temperatures ranging from 30° to 70°C. The change in Gibbs free energy (∆G°), change in entropy (∆S°) and change in enthalpy (∆H°) were calculated based on the equations 10, 11& 12 [11]: In the equations above, Kc is the equilibrium constant, Ca and Ce represent the quantity of Congo red dye adsorbed on the adsorbent and the final concentration of the solution, respectively. T is the temperature in kelvin and R= molar gas constant which is 8.314 JK-1mol-1.
The Gibbs free energy change (∆G°) values for the adsorption experiment at different temperatures were obtained as negative values (Table 3), indicating that the sorption process was spontaneous [13,15]. The change in enthalpy value calculated was obtained as15.721 KJ/mol, and the change in entropywas 53.15 J/mol. The positive value of these two thermodynamic parameters depicts an endothermic process [13]. Since the range of the free energy is less than 20 KJ/mol, the thermodynamic investigation could be concluded as a physical sorption process which is spontaneous and endothermic[9,11].
Conclusion This research focused on the synthesis and characterization of a Cu (II) coordination compound containing mixed carboxylate and nitrogen donor ligands for dye adsorption. The study aimed to contribute to the field of environmental remediation and wastewater treatment by investigating the potential of this compound as an effective dye adsorbent. Throughout this research, a systematic approach was followed, starting with the synthesis of the Cu (II) coordination compound through a well-defined procedure. This involved the selection of suitable ligands and optimization of reaction conditions to obtain a stable and efficient adsorbent. Optimum conditions for Congo red dye adsorption were observed to be 25 mg/L dye concentration, time of 4 h, at alkaline pH, temperature of 40°C, and adsorbent dosage of 0.01 g. Equilibrium adsorption isotherms, kinetic studies, and thermodynamic analyses were performed to elucidate the adsorption behavior and mechanisms. The results indicated that the Temkin isotherm model and pseudo-second order kinetic model best-fit the adsorption data obtained in this experiment. The thermo-dynamic studies carried out showed a rapid dye removal process indicating that the [Cu(BTCA)(AMB)] adsorbent is a promising material for remediation of dye polluted water.
References
|
||||||||||||||||||||||||||||||||||||||||||||||||||||||||||||