|
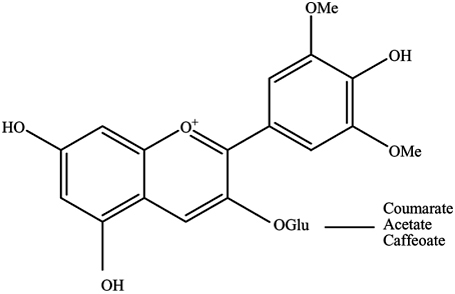
Introduction Anthocyanins represent a unique subset of phenolic secondary metabolites found in plant tissues. They are one of many compound classes that fall under the flavonoid group, possessing a bi-phenolic structure which can be glycosylated, and the glycosides may be acylated, giving rise to a plethora of potential structural and functional variants [1]. The aglycone flavylium cation is referred to as an anthocyanidin. Anthocyanins differ from the rest of the flavonoid group by a formal positive charge found on the oxygen of the pyran ring (Figure 1). Recently, anthocyanins has attracted considerable attention because of their antioxidant activity [1-2]. They protect against oxidative damage from radical reactive species by various mechanisms that ultimately result in the neutralization of free radicals. Owing to the anthocyanin’s positive charge and aromatic hydroxyl groups, these compounds can easily donate protons to the free radicals [3]. This protects cells from oxidative damage that leads to aging and various diseases. Up to 600 different species have been reported [4]. The color of anthocyanins depends on their structure, the acidity of the environment, and the presence of copigments [5]. Nowadays, various pretreatment techniques followed by chromatographic analysis have been developed to extract anthocyanins from different samples that affect the yield, quality, and composition of targets. Some of them are solid-phase extraction (SPE), conventional extraction (CE), ultrasound-assisted extraction (UAE) and accelerated-solvent extraction (ASE) [6]. Traditional methods including maceration and turbo extraction (high-speed mixing) are very often time-consuming and require relatively large quantities of polluting solvents [7]. Recently, pressurized liquid extraction (PLE) was used to extract anthocyanins from the red grape skins. Ultrasound-assisted extraction (UAE) is often used for the extraction of plant material using a liquid solvent. This extraction process is faster and more complete than maceration, due to the greater surface area in contact between the disrupted solid particles and liquid phase [2]. Several studies show that ultrasound-assisted extraction (UAE) has many advantages over the conventional extraction methods including shorter time, less solvent, and higher extraction efficiency [8]. One major challenge in the utilization of the UAE procedure for the extraction of anthocyanins from the real sample is the selection of experimental conditions that can provide the optimum recovery [2]. Anthocyanins analysis has been extensively studied but it is still hampered by the limitation of available calibration standards. Classical chromatographic methods, such as planar chromatography and open column chromatography, still play a role in the analytical analysis of anthocyanins, but HPLC is now the standard method for both analytical and preparative applications. HPLC coupled with UV–Vis, photodiode array (PDA), or mass spectrometer (MS) detectors are commonly used [3].
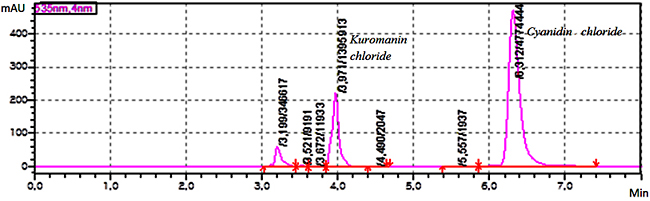
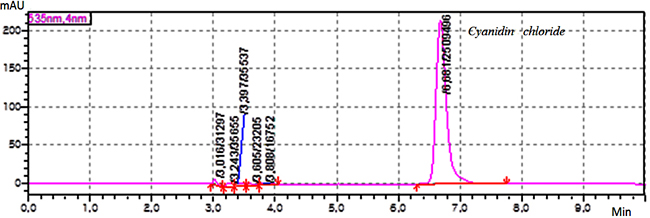
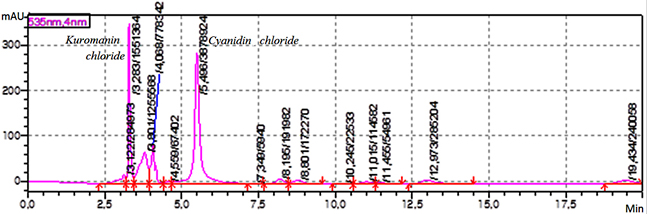
Experimental Sample material Grape pomace the harvest (2016) of “Saperavi”, red sort of wine grape has been provided by local wine factory from Kakheti region, Georgia. A huge amount of solid waste leftover from wine processing generally consist of pulp, seed, and skin. The fresh waste material is highly perishable especially, after 15-18 days of maceration. Dehydration of waste material is the first step before extraction and a useful means to increase the shelf-life of grape pomace. The grape skin was dried in the laboratory under controlled conditions (the temperature – 20-25°C and the relative humidity – 30-60 %) and protected from direct sunlight. Reagent and chemicals The certified analytical standards of cyanidin chloride and kuromanin chloride, the HPLC grade acetone, ethanol, ethyl acetate, acetonitrile, methanol, the analytical grade hydrochloric acid, formic acid and phosphoric acid from Sigma-Aldrich were used. Instrumentation An eco-friendly laboratory supercritical fluid extraction dynamic system (500 mL) was used for sample extraction. The previously weighed sample was loaded in a stainless steel basket of an extractor. The carbon dioxide was compressed and chilled at -5°C. Liquefied CO2 was pumped continuously into the vessel at the specific extraction conditions. Elmasonic P 300 H ultrasonic bath (Elma Schmidbauer, Germany) was used for ultrasound-assisted extraction. The HF-frequency was 37 and 80 kHz; the temperature was controlled during ultrasonication [9]. IKA C-MAG MS magnetic stirrer (IKA-Werke, Germany) was used for magnetic stirring extraction. The stirring speed was 100 – 1500 rpm and the temperature was 25 – 60°C. The HPLC grade water was prepared using Milli Q Adventage A10 purification system (Merk-Millipore, France). Chromatographic system and conditions The HPLC method was developed using a column - Agilent SB-C18 4.6x250 mm, 5 μm (Agilent Technologies, USA) with isocratic elution of the mobile phase (MP) – a mixture of MP A (a mixture of water and formic acid 90 : 10 v/v) and MP B (a mixture of water, acetonitrile, methanol and formic acid 40:22.5:22.5:10 v/v) 50 : 50 v/v; the flow rate of elution was 1.0 mL/min; The detector wavelength was 535 nm; the injected volume was 20 μL; the temperature of analyte was maintained at 4°C; The column temperature was maintained at 30°C. The mixture of water and 85 % phosphoric acid 90: 10 v/v and the mixture of methanol and hydrochloric acid 98:2 v/v were used as diluent A and B, respectively. Preparation of kuromanin chloride standard solution 10 mg of standard of kuromanin chloride was weighed and transferred to 100 mL volumetric flask, dissolved in 30 mL diluent A and diluted to volume with the same diluent, mixed well. The obtained solution was filtered through 0.45 µm polyvinylidene fluoride (PVDF) microporous membrane filter, discarding the first 5 mL of the filtrate (Stock solution). 1 mL of this solution was transferred to 10 mL volumetric flask, diluted to volume with diluent B, mixed well (10 μg/mL). Preparation of cyanidin chloride standard solution 20 mg of standard of cyanidin chloride was weighed and transferred to 50 mL volumetric flask, then dissolved in 30 mL diluent A, diluted to volume with the same diluent, mixed well. The obtained solution was filtered through a 0.45 µm PVDF microporous membrane filter, discarding the first 5 mL of the filtrate (Stock solution). 1 mL of this solution was transferred to 10 mL volumetric flask and diluted to volume with diluent B, mixed well (40 μg/mL). Preparation of system suitability check solution 4 mL of standard stock solution of kuromanin chloride and 1 mL standard stock solution of cyanidin chloride were transferred to 10 mL volumetric flask, diluted to volume with a diluent, and mixed well (40 μg/mL). Calculation formulae The concentration of total antocyanins - Cu, μg/mL in the extract sample solution was calculated by the following formula: Cu = Au × W1 × D1 × P× 1000 / As. Where, Au – Sum of peak areas corresponding antocyanins obtained with the extract sample solution; as - Peak area of cyanidin chloride obtained with the standard solution; W1 – Weight of cyanidin chloride standard, mg; D1 - Dilution factor; P - Purity of standard, %. Method validation The developed method was validated with respect to robustness - standard solution stability and filter compatibility test, system suitability test, specificity, linearity-range, accuracy, precision, limit of detection (LOD) and quantitation (LOQ) according to ICH guideline and statistical assessment was performed using Microsoft Excel 2010 [9-11]. Results & Discussion Sequential supercritical fluid extraction The effect of the operating pressure and the temperature, extraction time, the flow rate of the SC-CO2, the sample size and the nature of the solvent used was investigated to develop the sequential extraction procedure and establish their optimal parameters. The effect of pressure on the extraction of anthocyanins was investigated by carrying out the experiments at pressures from 100 to 250 atm. The flow rate of SC-CO2 was kept constant at 2 mL/min throughout the extraction. The temperature (50°C) was selected to prevent thermal degradation of target analytes. To investigate the effect of temperature on the extraction the experiment was carried out at the different temperatures – 40, 50, 60 °C; the extraction pressure and the flow rate of SC-CO2 were kept constant at 200 atm and 2 mL/min, respectively. The effect of the flow rate of SC-CO2 on the extraction was investigated at the different flow rates – from 1 mL/min to 5 mL/min. The optimal operating temperature and pressure were established in the previous experiments. Also, the effect of the sample size (grape skin) ranging 10 – 30 g was investigated on the extraction of target analytes. Hence, the extraction procedure for the supercritical fluid extraction of antocyanins from dried samples was developed. The optimal parameters are: the sample size – 20 g, the extraction pressure – 200 atm, the extraction temperature - 50°C, the equilibrium extraction time – 180 min, the dynamic extraction time – 60 min, the flow rate of SC-CO2 – 2 mL/min; The obtained colorless residue indicated complete extraction of target compound. In the experiment, the mixtures – acetone/water, ethanol/water and ethyl acetate/water acidified hydrochloric acid (pH 4-7) were used as co-solvents. The results of the experiment show that the effect of pressure on the recovery of antocyanins at a constant temperature is a function of the amount of SC-CO2. The solubility of target analytes increased with an increase of pressure. The content of total antocyanins decreases at the higher extraction temperature at a constant pressure, also the recovery of target compounds increases with an increase of the extraction time at a constant temperature as well. Also, the effect of sample size is a function of the extraction time. The less the sample size is, the more is the extraction time and the more the flow rate is, the less is the extraction time. The use of co-solvent – ethanol/water (50:50 v/v) at pH 4 increases the recovery of antocyanins. Sequential ultrasound-assisted extraction The results of the UAE procedure indicate that the effects of the extraction time, the composition of the solvents mixture, as well as the temperature and ultrasound power, are significant for analytes. The effect of the extraction time on the extraction of antocyanins was investigated by carrying out the experiments during 25, 50, 60 and 90 min. It was observed that the recovery of antocyanins increased exponentially in 15-30 minutes. Most of the antocyanins extracted during the 2/3 of total extraction time (30 min), then ultrasound degradation leads to the reduction of the number of antocyanins due to the side effect of ultrasonication. Thermal effect plays an important role in UAE. At comparatively low ultrasonic power (37 kHz) and temperature (25-50 °C), the thermal effect can be ignored because the heat produced by ultrasound may be completely diffused. The high ultrasonic power (80 kHz) causes the thermal effect on thermally sensitive target substances. In the experiment the mixtures – acetone/water and ethanol/water (from 50: 50 to 90: 10 v/v) were used as solvents. The solvent’s mixture was acidified by hydrochloric acid (pH 4). The extraction temperature varied in the range 25-60 °C. It was observed that the influence of the composition of the solvents mixture was important. Hence, the three-step extraction procedure for ultrasound-assisted extraction of anthocyanins from dried samples was developed. The ultrasonic bath was set at 37 kHz; the optimal parameters are: the sample size – 5 g, the extraction time – 30 min, solvent’s mixture – acetone/water (70: 30 v/v) and acetone/water (50: 50 v/v) (pH 7), the temperature of extraction is 25°C and 50°C, respectively. The obtained organic extracts were transferred to dark glassware and stored under refrigeration. For HPLC analysis the extracts were transferred to a dark volumetric flask and diluted to volume with the diluent, mixed well. The sample extract solutions were filtered through 0.45 µm PVDF microporous membrane filter, discarding the first 5 mL of the filtrate. Magnetic stirring extraction The results of MSE procedure indicate that the effects of the extraction time, the extraction temperature and the composition of solvent’s mixture are significant for the analyte. The effect of the extraction time on the extraction of antocyanins was investigated by carrying out the experiments during 20, 30 and 40 min. It was observed that the recovery of antocyanins increased exponentially in 10-20 minutes. Most of the antocyanins extracted during the 2/3 of total extraction time (30 min), then photodegradation leads to the reduction of the number of antocyanins due to the side effect of light. In the experiment, the mixtures – acetone/water, ethyl acetate/water, and ethanol/water (from 50: 50 to 90: 10 v/v) were used as solvents which were acidified by hydrochloric acid (pH 4). It was observed that the influence of the composition of the solvents mixture was important. Hence, the three-step extraction procedure for MSE of antocyanins from dried samples was developed. The optimal parameters are: the sample size – 5 g, the extraction time – 30 min solvent – acetone/water (70: 30 v/v) and ethanol/water (50: 50 v/v) acidified hydrochloric acid (pH 4), the temperature of extraction is 60°C. The obtained organic extracts were transferred to dark glassware and stored under refrigeration. For HPLC analysis the extracts were transferred to a dark volumetric flask and diluted to volume with diluent, mixed well. The sample extract solutions were filtered through 0.45 µm PVDF microporous membrane filter, discarding the first 5 mL of the filtrate. Optimization of chromatographic system conditions The final chromatographic conditions were determined by optimizing the system operational parameters: the wavelength for detection, the gradient program of the mobile phase, the composition of mobile phase, the flow rate, the nature of stationary phase and the injection volume. The system suitability parameters – theoretical plates, tailing factor and peak purity – were checked. Method Validation Specificity The specificity was checked by injecting the standard solutions, the system suitability check solution, the background control – blank and the sample extract solution. It has been shown that there is no interference from the blank at the retention time of an analyte’s peak. The retention time for principal peaks on the chromatogram obtained with sample extract solution corresponds to that of the respective peaks in the chromatogram obtained with the standard solution. Both principal peaks are pure. Purity factor (993 for kuromanin chloride and 997 for cyanidin chloride) was more than purity threshold (990.0). Figure 2 shows the chromatogram obtained with the system suitability check solution.
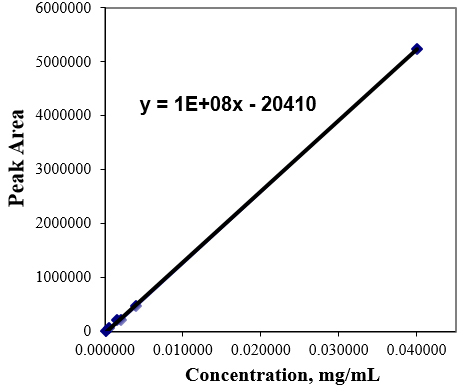
Linearity and range From the standard stock solution, working solutions were prepared at six different concentration levels ranging from 0.08 μg/mL to 40μg/mL for cyanidin chloride. Three replicate injections (n=3) were performed at each concentration level. The linearity was checked by the correlation coefficient (acceptance criteria: >0.990), the square of the correlation coefficient (acceptance criteria: >0.98). The calibration curve was constructed by plotting the response area against the corresponding concentration of the injected solutions. A value closer to the unit of the correlation coefficient indicates a good linearity. The calibration plot and the corresponding statistic parameters of the regression are shown in Figure 3 and Table 1.
Limit of quantitation (LOQ) and limit of detection (LOD) The signal-to-noise ratio (S/N) was adopted for the determination of the LOQ. This is estimated to be ten times the s/N ratio; the LOQ is estimated to be three times of S/N ratio (acceptance criteria). The LOQ was achieved by injecting a series of stepwise diluted solutions and precision was established at the specific determined level. The RSD, % of peak areas should not be more than 10 % (acceptance criteria). The determined LOQ and LOD for target analyte are presented in Tables 2. The LOQ of the method was estimated to be equal to 0.08μg/mL and 0.02 μg/mL could be considered according to the acceptance criteria.
System suitability test The system suitability test parameters were measured to verify the chromatographic system performance. System suitability was checked by six replicate injections (n=6) of the system suitability check solution. The main parameters including the RSD, % of peaks (acceptance criteria: <2.0 %), the RSD, % of the retention times (acceptance criteria: <1.0 %), the peak tailing factor (the USP coefficient of the peak symmetry) (acceptance criteria: < 2.0), the column efficiency – the number of theoretical plates (acceptance criteria: >2000) and the resolution factor (acceptance criteria: >7) were measured. The results are summarized in Table 3.
Accuracy The accuracy of the method was assessed by comparing the analyte amount determined versus the known amount spiked at two different concentration levels with three replicate injections (n=3). The sample solutions were spiked with a standard solution at 40.0 μg/mL, 20.0 μg/mL concentrations of cyanidin chloride. The accuracy is expressed as the percentage of standard compound recovered from a spiked solution (extract sample solution+standard) with a corresponding RSD, %. The average recovery should be within 85.0 –115.0 % and the RSD, % of the percentage recovery should be <6.0 % for each concentration level of spiked sample solution (acceptance criteria). The recovery– Rec, % for each concentration level of spiked solution was calculated by the following formula: Rec, % =(Au1 – Au2) × 100/As. Where, Au1 – the peak area obtained with the spiked sample solution (endogenous added cyanidin chloride standard), Au2 – the peak area of obtained with the sample solution (endogenous added cyanidin chloride standard) and As – the peak area obtained with the standard solution. The average recovery equals 95.62 %. Precision The precision was estimated by measuring repeatability on six individual determinations of total anthocyanins in the extract sample solution at the same concentration. This parameter was checked by the RSD, % of determined concentrations (μg/mL) for six individual determinations of target compound which should not be more than 3.0 %; the results are given in Tables 4. The RSD, % of determined concentrations (μg/mL) for six individual determinations of total anthocyanins complies with the acceptance criteria which indicate that this method has a good precision. Standard Solution Stability The standard solution stability was studied by injecting standard solutions of cyanidin chloride initially, after 6, 24 and 48 hours against the freshly prepared standard solution. This parameter was checked using two standard solutions and calculated the percentage bias between peak areas of standard solutions stored under refrigeration in dark glassware and freshly prepared which should not be more than 3.0 % (acceptance criteria). The bias in terms of peak area between two standard solutions should be within 0.98-1.02 (acceptance criteria). The standard solution is stable for the period up to 6 hours prepared in refrigerator and dark glassware (2.75 %).
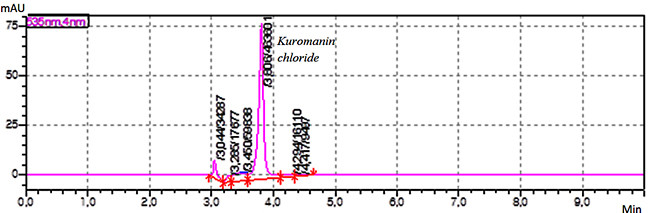
Filter Compatibility Test The PVDF membrane filter compatibility was evaluated using standard solution and by calculating the percentage bias between peak areas obtained with standard solutions filtered and non-filtered which should not be more than 0.5 % (acceptance criteria). The result is 0.19 % which gives the confidence that adsorption of target compound does not occur on the used filter. Estimation of Total Anthocyanins in Dried Samples The organic extract solutions prepared using the developed supercritical fluid, magnetic stirring extraction, and ultrasound-assisted extraction procedures and were analyzed using the validated HPLC method. Figure 4, 5, 6 show the chromatograms obtained with a korumanin chlorid standard solution, cyanidin chloride standard solution, and extract sample solution, respectively. The content of total anthocyanins in μg per g of dried grape skin was calculated as well. The results are given in Table 5.
Conclusions Hence, the developed sequential extraction techniques of the major anthocyanins using ultrasound-assisted, magnetic stirring and supercritical fluid extraction are simple, effective, eco-friendly separation procedures, which provide a high quality of target compounds and can be used to develop a standard technological process for utilization of agro-industrial waste material – grape skin. Also, the developed and validated HPLC method for quantitative determination of total anthocyanins is rapid and selective analytical procedure which can be successfully used by scientific and quality control laboratories. Conflict of interests The authors declare no conflicts of interests. Acknowledgments The research was financially supported by Shota Rustaveli Georgian National Science Foundation under the fundamental research grant #217138. References
|
|||||||||||||||||||||||||||||||||||||||||||||||||||||||||||||||||||||||||||||||||||||||||||||||||||||||||||||||||||||||||||||||||||||||||||||||||||||||||