|
Introduction Floating drug delivery systems "FDDS" or hydrodynamically controlled systems are low-density systems to remain buoyant in the stomach for a long time without affecting the rate at which the stomach empties. While floating on the gastric contents, the drug is gradually taken from the body at the desired rate. Immediately after taking the drug, the stomach's remaining systems are flushed out. A longer period of stomach retention and improved control over plasma medication concentrations are achieved as a result [1]. Additionally, a certain level of floating force (F) is needed to maintain the dose form stable on the surface of the meal so that the buoyancy retention principle can be appropriately applied. Buoyant systems can be made using granules, powders, capsules, tablets, laminated films, and hollow microspheres, among other things [2-15].
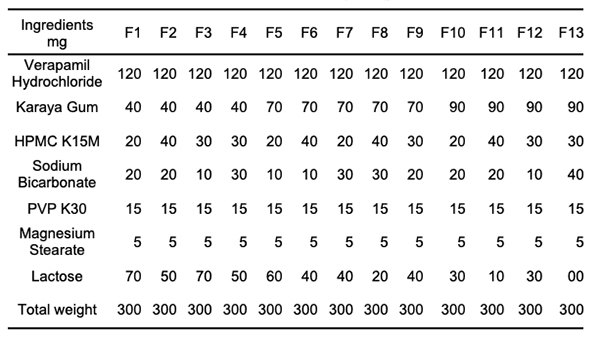
Materials & Methods Formulation of Effervescent Floating Tablets Verapamil hydrochloride floating tablets were made using the direct compression method. We blended HPMC-K15M, karaya gum, sodium bicarbonate, and diluents for ten minutes before adding magnesium stearate to each tablet formulation, which included the medicine. Table 1 shows the formulation chart of effervescent floating Verapamil hydrochloride tablets. Each tablet had a total weight of 300 mg. HPMC was utilized in the range of 20-40 mg, and karaya gum was used in the 40-90 mg range. A mortar and pestle were used to knead the powder combination for another 5 minutes [16,17].
Technological Characteristics of Floating Tablets Weight variation test
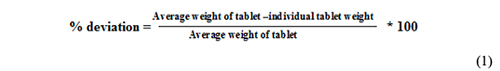
Friability
where % F is percentage friability, W is the initial weight of the tablet, and Wt is the final weight of tablets after revolutions. Hardness Thickness and diameter Uniformity of drug content
Drug-excipient Compatibility Studies Fourier transforms infrared spectroscopy (FT-IR) Differential scanning calorimetry (DSC) In vitro floating studies [20]
Water uptake studies [21]
Results & Discussion Technological characteristics of floating tablets
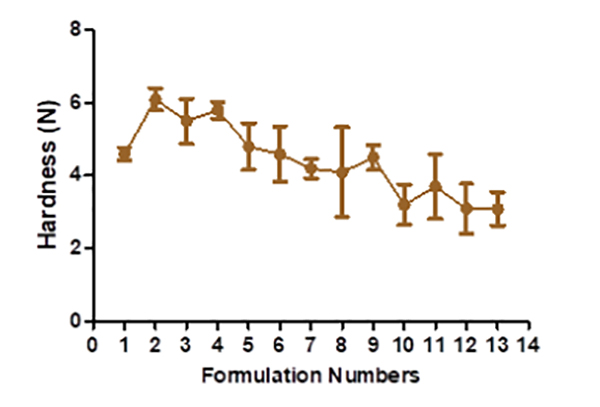
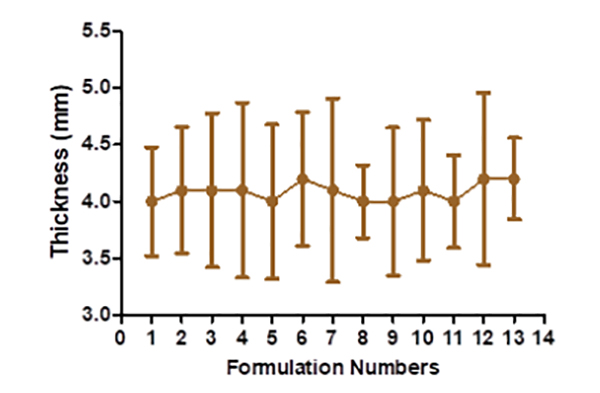
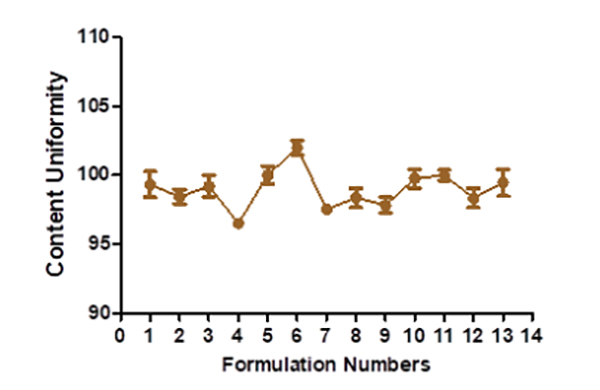
The hardness of floating tablets ranged from 4.1 ± 1.23 to 6.1 ± 0.306 kg (Figure 2), depending upon the mixture of the polymer used. The tablet formulation's friability ranged from 0.3 ± 0.0063 to 0.59 ± 0.0076%. The manufactured tablet formulation's weight fluctuation is within USP guidelines. The thickness is discovered to be between 4.1 ± 0.48 and 4.2 ± 0.76 mm (Figure 3). The drug content assays ranged from 96.52± 0.37 to 102.03 ± 0.53% (Figure 4).
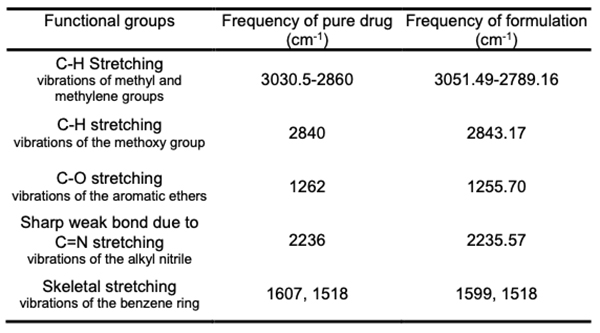
Fourier transforms infrared spectroscopy (FT-IR) Potassium bromide dispersion is used to measure the spectra in the solid-state. The FT-IR technology was used to capture the bands. The FT-IR spectral study found that the pure drug and the drug formulation have similar distinctive peaks with slight changes (Table 2). As a result, it was determined that the medication and polymer utilized have no chemical interaction.
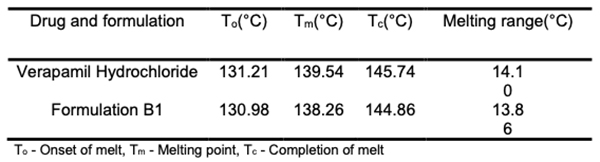
Differential scanning calorimetry (DSC) Screening for compatibility between drugs and excipients is made more accessible with DSC, which provides a wealth of data on potential interactions in a short period (Table 3). Verapamil hydrochloride and formulation B1 underwent a DSC study. An endothermic peak at 138.25oC, the drug's melting point, maybe seen on its thermogram. The melting point of the medication is found to be 139.53oC in the matrix tablet formulation B1. The medication and excipients have no interaction, according to the analysis of thermograms obtained using DSC [22,23].
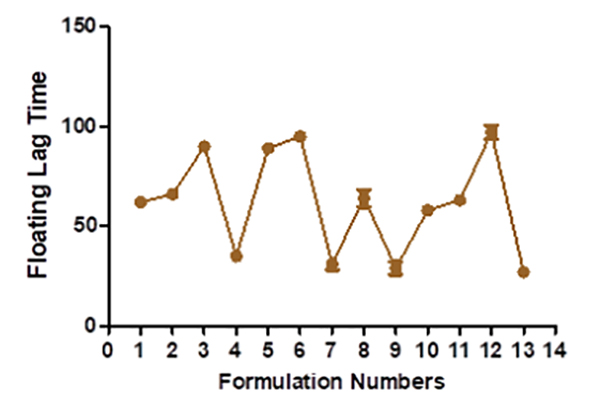
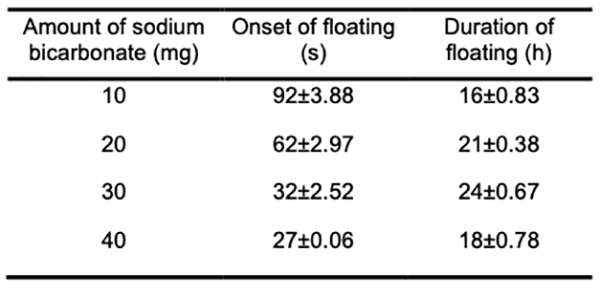
In vitro buoyancy studies The tablet turns buoyant when its density drops below 1 g/ml. Tablets made with karaya gum, and HPMC has good gel strength, allowing CO2 gas to be trapped inside and resulting in a long-lasting buoyancy. The system must float for a few minutes after contact with stomach fluid to prevent the dose form from being pushed into the small intestine with food. Experiments show that as the effervescent agent and karaya gum increases in B13, it takes longer for the system to float in the medium. The more significant concentration of effervescent agents resulted in more CO2 being produced faster and at a higher rate. A high level of buoyancy necessitated sodium bicarbonate. In general, the gastric emptying time was 4 hours. Because Verapamil hydrochloride is absorbed mainly from the proximal section of the intestine, the longer the medicine is in the stomach, the more it is absorbed (Table 4) [24].
Water uptake studies At one hour, the B4, B6, and B7 swelled by a large percentage. At the end of 8 hours, B8 exhibited a steady increase in the proportion of swell. The use of karaya gum slows down the water intake in the first hour. During the 8 hours, the levels of B2, B3, and B5 decrease. Sodium bicarbonate concentration does not affect the swelling properties, but lactose concentration in B8 has the most significant effect (p ≥ 0.05) (Figure 5).
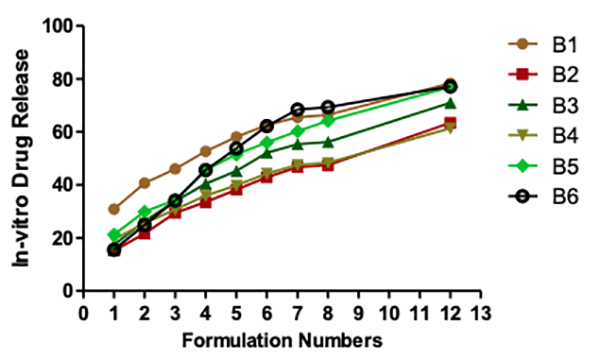
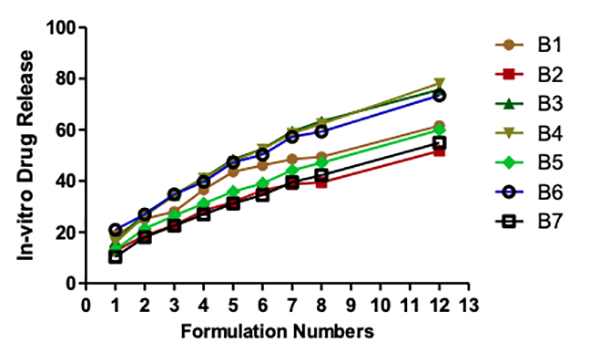
Seipmann and Peppas think that the water content of the tablet has a considerable impact on the diffusion of the medication. To understand why this can be the case, we need to understand how water affects the mobility of polymer chains. Polymer chain relaxation occurs with volume increase, resulting in a significant system swell. Higher water content can also indicate faster stomach fluid entry into the tablet, resulting in faster CO2 gas generation and reduced floating time. As a result, the tablet swells faster and more rapidly, increasing the tablet's dimensions and decreasing diffusion rates. In vitro drug release studies There is more than 75% drug release at 12 hours for each of the following: B1, B5, B6, B9, and B10. At a maximum of 30% in the first hour and for nearly 12 hours, the B1 maintained a steady release of the medication. B8 shows the lowest drug release of all the formulations, which may be due to the substantial gel barrier on the tablet. Other formulations with a more extensive swelling index were shown to have a similar effect on drug diffusion across the gel barrier. B1 had a more excellent lactose content than any of the other samples. An infusion media dispersed into the matrix, leading to drug diffusion and controlled release from tablets (Figures 6 and 7).
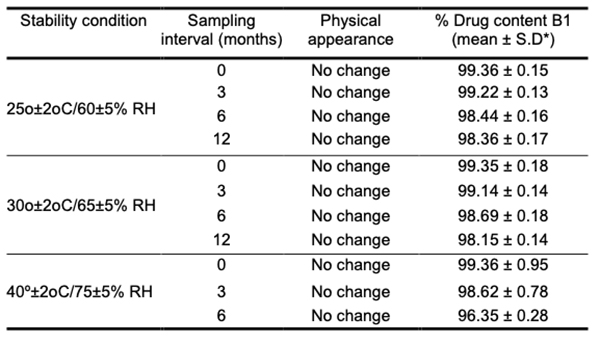
Mathematical model fitting of obtained drug release data To further understand the in vitro drug dissolution profiles, we use various mathematical models, including the Korsmeyer-Peppas equation and Higuchi kinetics, to examine the data. The PCP disso v2.08 software was used to determine the release rates k and n for each model. In order to assess the model's accuracy, correlation coefficients (R2) were used. Table 6.08 lists the R2, k, and n values. Korsmeyer-Peppas and Matrix models were compared using R2 values; the Matrix model was found to have the best R2 values, while Korsmeyer-Peppas had the best R2 values for the other models. There is a wide range in the diffusion exponent. Fickian release was observed in B1, B4, and B7, while the non-Fickian or anomalous release was observed in other formulations. With the Fickian release, B4 and B7 are the best-fitting matrix models; with the non-Fickian release, B5 and B12 are the best-fitting matrix models. Fickian diffusion is employed when the value of n in Korsmeyer-Peppas is 0.5 or less, whereas diffusion with n values between 0.5 and 1 is used for anomalous or non-Fickian releases. When the release mechanism is unclear or numerous types of release phenomena are possible, this model is utilized to explore the release of pharmacological polymeric dosage forms. Fick's laws are the foundation of diffusion, which describes the macroscopic transit of molecules along a concentration gradient.Stability studies The optimized formulation B1 was subjected to stability testing to determine the effect of formulation additions on both the chemical and biological stability of the medicine. It was tested for 12 months at 25oC/60 percent R.H., 30oC/65 percent R.H., and 40oC/75 percent R.H. During the course of the study, neither the external appearance nor the pharmacological content changed appreciably. Table 5 provides the results of drug content determination during the period when the stability tests were conducted. Long-term and accelerated storage data were analyzed using Sigmaplot 12.0 software, as was the 95 percent confidence interval. According to the findings, the changes in the parameters evaluated were minor and insignificant.
Conclusion Direct compression was used to make the tablets. They met pharmacopeial standards for floating tablet technology. More than 8 hours later, the tablets were still floating. After 8 hours, all of the produced formulations have reached complete swelling. Therefore, the percentage of swelling was calculated at that point. More than 75% of the medication was released after 12 hours in F1, F5, F6, F9, and F10. Maximum 30 percent drug release occurred in one hour and continued for over 12 hours with F1. Formulation F1 is deemed the most optimal based on the results of the in vitro testing.
References
|
||||||||||||||||||||||||||||||||||||||||||||||