|
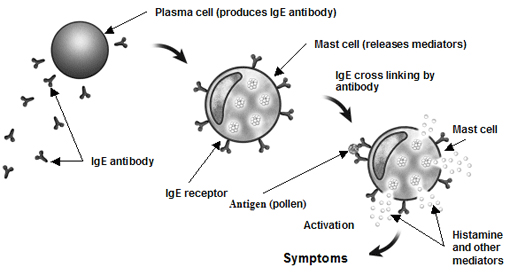
Introduction To Immunoglobulin E The antibody known as immunoglobulin E (IgE) is responsible for the mediation of immediate hypersensitivity reactions that cause hay fever, asthma, hives, and anaphylactic shock, and for assisting the body’s host defenses against parasitic infection. The first biological assay to test for IgE was conducted by K. Prausnitz and H. Kustner in 1921 and is now known as the P-K reaction. They discovered the presence of an unknown serum component responsible for allergic reactions by injecting serum from an allergic patient into the skin of a patient who was non-allergic. They then injected an allergy antigen into the same site and noted the appearance of redness and swelling [1]. IgE was officially identified in 1966 by K. and T. Ishizaka. They immunized rabbits with serum from an allergic patient to make an anti-isotype antiserum. IgG, IgA, IgM, and IgD were then allowed to react to the rabbit antiserum causing their antibodies to precipitate. An unknown anti-isotype antibody still remained in the antiserum after this because it was able to completely block the P-K reaction. This unknown antibody was named IgE after the E antigen found in ragweed pollen [1]. IgE Function IgE is the least common immunoglobulin in the body, but can bind with high affinity to Fc receptors on the surface of basophils and mast cells. It has the ability to bind with far greater effectiveness to these high affinity receptors than other immunoglobulin classes. The molecule also possesses low affinity receptors capable of cross-linking to antigens and initiating an immune response. Once IgE binds to an antigen, it initiates conformational changes in the mast cells that cause them to release histamine, serotonin, leukotrienes, and other chemicals responsible for hypersensitivity reactions. Even though IgE is usually associated with allergic reactions, its main function appears to be protection of the body from parasites. Once a parasite has been coated with IgE, eosinophils are alerted, bind to the Fc receptors on the IgE-parasite complex, and destroy the invading organism [2].
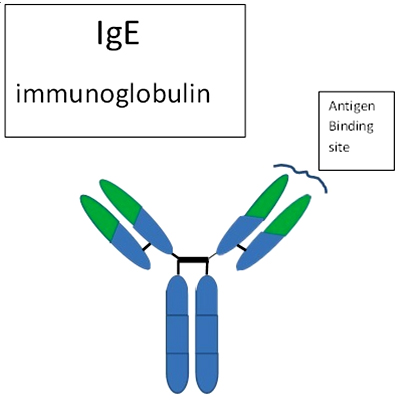
IgE Structure The structure of IgE is made up of two pairs of heavy and light chains that are joined by disulfide bridges. The molecule can be separated into the antibody combing site (Fragment antigen binding) and another fragment (constant fragment) by using a digestive enzyme such as papain. Unlike other immunoglobulins, IgE has four constant heavy chain domains, with the second heavy chain acting as the hinge region. The light chains can be categorized into κ and λ chains, with IgE molecules typically having one type of light chain or the other [3]. The IgE antibody binding site can be found on the variable regions of the molecule at the amino terminal end. Although heavy and light chains can both be integrated into the antigen binding site, it is possible for one type of chain to possess all of the antigen binding activity (Holgate & Kemeny, 1995). The regions that are most active in the antibody combining site are those that have the most variability. These complementary-determining regions have structures best suited to the binding of antigen and are called CDR1, CDR2, and CDR3. Lastly, near the variable sections of the IgE molecule are framework regions that control the overall structure of the combining site. These regions do show some variation with the µ chains containing four framework regions and the λ chains containing five. The IgE constant region is composed of four heavy chain domains known as ε1, ε2, ε3, and ε4. These regions take part in mediating the effector functions of the molecule [3].
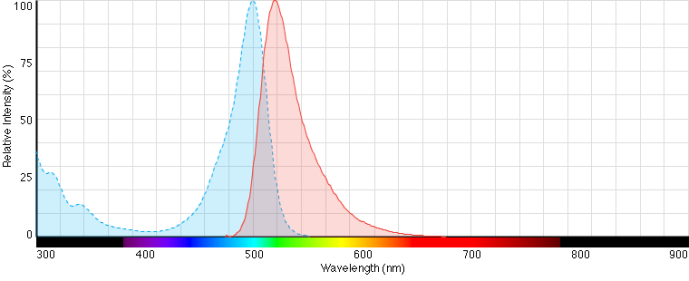
IgE Quantitation The normal IgE serum concentration range in adults is 10 – 40 μg/dL [4]. Currently, the most common techniques to detect antigen-specific IgE in serum are radioallergosorbent test (RAST), radioimmunoassay (RIA), and enzyme-linked immunosorbent assay (ELISA). These tests are usually performed on patients suspected to have atopy, Wiskott-Aldrich syndrome, or hyperimmunoglobulin E syndrome. Physicians will also test IgE levels on patients with parasitic infections and bronchopulmonary aspergillosis. IgE is typically not measured in asthma patients due to the fact that serum IgE levels are only elevated in about one half of asthmatics [2]. Introduction to Fluorescence The use of fluorescence as a diagnostic tool has been of great value to clinical scientists because it allows them to study the structure and function of molecular proteins. Proteins have been demonstrated to emit luminescent light via excitation of ultraviolet light through the experiments of men such as Max Weber, Edwin Teale, and Sergei Konev. The experiments that these men conducted led the way to the discovery of properties of proteins such as their rotational freedom, amino acid side chain exposure, and intramolecular distances [5]. One of the single greatest advantages of fluorescence analysis of proteins is the minimal amount of analyte that is required to perform the experiment. Tryptophan and tyrosine residues are the most studied with tryptophan being the scientific favorite due to its sensitivity to its microenvironment and the fact that most proteins possess few tryptophan residues. The lack of plentiful tryptophan residues allows researchers to be able to pinpoint certain areas of the protein being studied. An example of this lies in the tryptophan indole side chain, where its emission spectrum sensitivity to polarity allows fluorescent probes to be able to differentiate between folded and unfolded protein conformations. This differentiation lies in the ability of fluorophores to compete with other molecules that are emitted on the same spectrum [5]. Instead of using nuclear magnetic resonance (NMR) or crystalline procedures to characterize large multi-protein structures, analysis of the energy transfer between the distances of donor fluorophores to an acceptor can competitively characterize the emission process of the protein structure being studied. This instance does not hinder the electronic dipoles of the molecule and allows accurate energy transfer measurements [5]. Fluorescent Probes In 1871, Adolph Baeyer synthesized what is now the most popular fluorescent probe in the world, fluorescein. Fluorescein has remained so popular because it is inexpensive, unpatented, and compatible with amine and sulfhydryl functional groups. The probe can take on several different prototropic forms. It retains a dianion form when in alkaline conditions; however, if the pH of solution decreases, one will observe a deprotonated carboxylic acid and a protonated hydroxyl group. If the pH decreases even more the probe will take on a zwitterion form and will become non-fluorescent. This pH dependent characteristic of fluorescein makes its absorption and emission maxima approximately 490 nm and 520 nm at an alkaline pH [6]. Fluorescein isothiocyanate (FITC) is currently the most common form of fluorescein. It was synthesized as a replacement for the isocyanate derivative of FITC and acts on primary amines and lysine residues of proteins. Other forms of fluorescein include iodoacetamidofluorescein, which acts on cysteine residues of proteins, and N-hydroxysuccinimidyl fluorescein, which acts on primary amines of proteins [6].
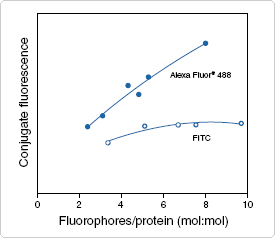
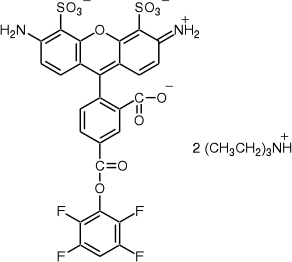
In the following experiment, the fluorescein fluorophore used was Alexa Fluor® 488 Dye carboxylic acid, tetrafluorophenyl (TFP) ester purchased from Invitrogen. Alexa Fluor® 488 is a green-fluorescent dye conjugate similar to FITC that was introduced in 1997. It produces a brighter conjugate than fluorescein, is less pH dependent, and is more photostable, while still being compatible with FITC filters, making it an ideal fluorophore for this experiment. The TFP ester form acts on primary amines and is now preferred over the original succinimidyl ester form because of its resistance to spontaneous hydrolysis during conjugation and its greater stability at an alkaline [7].
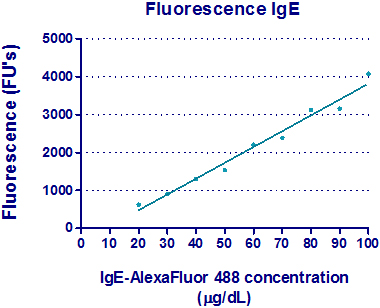
Materials & Methods Tagging of Alexa Fluor® 488 Dye to Human Purified IgE The tagging of Alexa Fluor® 488 Dye to human purified Immunoglobulin E (IgE) was done using a modified version of the Alexa Fluor® labeling protocol supplied by Invitrogen. Human purified IgE (Immunology Consultants Laboratory, Inc.) at a concentration of 1 mg/mL was added to 1 X Phosphate Buffered Saline (PBS) to make a 0.2 mg/mL concentration solution. 1 M sodium bicarbonate was added to the solution to raise the pH of the mixture and allow succinimidyl esters to react more efficiently. The mixture was then added to the tube of Alexa Fluor® 488 Dye carboxylic acid, tetrafluorophenyl (TFP) ester (Invitrogen) and mixed on a stir plate at room temperature for one hour. Excess Alexa Fluor tag was then removed by centrifugation using Millipore Centrifugal Filter Units (Fischer) leaving a final volume of 500 uL of tagged protein in 1 X PBS and stored at 40C in the dark. The concentration of the tagged IgE was determined using a NanoDrop 1000 spectrophotometer (Thermo Scientific). The absorbance of the tagged IgE was measured at 280 nm and 485 nm and the final concentration calculated to be 120 μg/dL using the following formula provided by Invitrogen: where 0.11 is a correction factor to account for the absorption of the dye at 280 nm. Fluorescence Detection Several different concentrations of IgE tagged with Alexa Fluor® 488 were diluted in pre-bleed rabbit serum and dispensed into different wells on a Costarμ Black 96-well plate (Biotek). Each well had a total volume of 25 μL with one well containing only rabbit serum that was assigned as a blank. The plate was then placed on a rocker and incubated for one hour at room temperature. The machine that was used to read the fluorescence intensity was a Biotekμ Synergy 2 Multi-Mode Micro-plate Reader that utilized Gen5 computer software to organize, interpret, analyze, and store the data that was acquired from the experiment. To run the micro-plate reader, a computer program was designed and written to outline the parameters of what the machine would measure, how it would measure it, and what data would be collected and analyzed. The tagged IgE was measured at a sensitivity of 35 with an 18 mm offset. The offset was the distance between the actual micro-plate reader and the sample well. The data was then interpreted on graphs using Graphpad Prism software. Result & Discussion The fluorescence intensity results along with the standard curve obtained from the experiment are shown below. The graph plots the fluorescence intensity (FU’s) versus the concentrations of IgE tagged with Alexa Fluor® 488 (μg/dL). The concentration of tagged protein in each well was carefully calculated and pipetted so that a standard curve could be obtained that could be compared to the fluorescence intensity measured by the multi-plate reader.
As shown on the graph below, a standard curve was created between 20 μg/dL and 100 μg/dL. The normal IgE serum concentration range in adults is 10 – 40 μg/dL [4] and was measured to have a fluorescence of approximately 1500 FU’s. A lower concentration of IgE was measured at 20 μg/dL and had a fluorescence of approximately 600 FU’s while the higher concentration of 100 μg/dL had a fluorescence of approximately 4000 FU’s. The consistent trend in fluorescence versus IgE concentration shows that human immunoglobulin E can be quantitated using IgE that is tagged with Alexa Fluor® 488 followed by measurement of its fluorescence using a micro-plate reader. Using this method as a clinical diagnostic tool, however, does pose many challenges. The first being that Alexa Fluor® 488 is an extremely expensive fluorophore and would not be cost effective to use on a daily basis. A solution to this problem would lie in the ability of a biotechnology company to standardize this procedure, making it cheaper to produce and thus cheaper to use in the clinical setting. This study had limited resources thus the testing in triplicate and cross-reactivity studies were not performed. This additional research should be performed in the future.
The second hurdle is the time it takes to purify and label the immunoglobulin E from the patient’s serum. To solve this issue, the experiment could have been taken a step further and used fluorescence polarization and an antibody to human IgE that was tagged with Alexa Fluor® 488. This would eliminate the need to purify the human IgE and would allow clinical scientists to simply spin down the patient’s whole blood and extract their serum. The IgE antibody tagged with Alexa Fluor® 488 would then be added to the serum and the fluorescence polarization would then be measured using the same micro-plate reader and a slightly different Gen5 computer program. This procedure would also be very expensive and would require the need of standardization from a major biotech company to make it cost effective. This additional fluorescence polarization experiment was not performed due the additional expense of the immunoglobulin E antibody but could be performed in the future provided that funding for the experiment was available. Acknowledgements The author would like to express his sincerest gratitude to Dr. Gordon Cannon and Dr. Sabine Heinhorst of the University of Southern Mississippi Department of Chemistry and Biochemistry for generously donating the Alexa Fluor® 488 and use of their laboratory and Biotek Synergy 2 Micro-plate reader. The author would also like to give thanks to Medical Technology Department at the University of Southern Mississippi; especially Dr. Jane Hudson, Dr. Margot Hall, and Dr. Mary Lux for funding the purchase of the human purified immunoglobulin E. The authors would also like to acknowledge W. Adam Shirley for providing original data from the study in Tables 1 & 2 and Figure 5. Special thanks are also conveyed to Martha Sparrow, Evan Roberts, and Jenifer Milam for sharing their invaluable knowledge of writing, math, and science. Lastly, the author would like to express his love and gratitude to his wife Megan for her understanding and support throughout the course of this project and for being his inspiration in life. References
|
|||||||||||||||||||||||||||||||||||||||||||||||||||||||||||||||||||||||||||||||||||||||||||||||||||||||||||||||||||||||||||||||||||||||||||||