|
Introduction Nanotechnology assumes a vital part in present day research [1,2]. Nanotechnology is the most proficient innovation that can be connected to all fields, such as pharmaceutical, gadgets, the health industry, nourishment and bolster, biomedical science, medications, the synthetics industry, vitality science, cosmetic agents, ecological wellbeing, mechanics, and space ventures. Nanotechnology has likewise been used for medicines to fight infection [3], cancer [4], allergy [5], diabetes [6], and inflammation [7]. Green chemistry is an execution, advancement, and foundation of compound preparation. Materials and procedures for synthesis of nanomaterials are used to minimize the utilization of dangerous chemicals to the environment [8]. There are many methods for the preparation of nanoparticles, such as sol-gel procedure and co-precipitation. Contrasted with those strategies, green synthesis procedures are one of the best techniques to create nanoparticles for cost adequacy, effortlessness, utilization of lower temperatures, and the use of less dangerous materials, and is perfect for therapeutic and nourishment applications [9,10]. Numerous specialists utilized green blend strategies for various metal nanoparticles because of their developing need of eco-accommodating properties [11]. Green combination procedure has been shown to be the best technique when contrasted with the other procedures; for example, concoction lessening, photochemical decrease, electrochemical diminishment, and warm vanishing [12]. In this study, the plant extract has been utilized as the capping and the reducing agents for the blend of copper nanoparticles due to their lessening properties introduced in the leaf extract [13,14]. In the course of recent years, the metal nanoparticles have been used in investigations for their potential applications in various fields, such as attractive recording media or smaller scale hardware, catalysis [15], nano-sensors, nanoelectronics, optoelectronics, and data stockpiling devices [16]. A few properties such as morphology, size, and appropriation of the particles arise from the nanoparticles [17]. Copper is the most broadly utilized metal due to its electrical, optical, synergist, biomedical, and antifungal/antibacterial applications among different metal particles, compared to gold, silver, palladium, zinc, and quantum dots [18]. Copper results in higher yields and response rate in mellow response conditions when contrasted with other customary catalysts [19]. Copper nanoparticles act as an antimicrobial agent in different fields. The copper is exceptionally toxic to microscopic organisms, such as E-coli, Staphylococcus aureus, and Pseudomonas aeruginosa, and non-poisonous to creature cells. Because of this, copper is considered to be a compelling bactericide that is safe for humans in nourishment bundle applications and in water treatment applications [20-22]. Different plants were utilized for the amalgamation of nanoparticles utilizing green synthesis procedure. Nanoparticles were integrated from each part of the plant independently; like the seed, stem, bloom, leaf, and skin of the natural products. The nanoparticles blended from plant concentrate were observed to be secured by the restorative properties of plant concentrate, which could be utilized as a part of meditation that is focused on medication conveyance and corrective applications [23]. In this work, Odina wodier gum is used for the synthesis of copper nanoparticles. The plant, Odina wodier, is a moderate-sized or large deciduous tree with thick, soft branches belonging to the family Anacardiaceae. The Odina wodier tree is found in tropical parts of India. Odina woider bark decoction is used as astringent in patients with atonic dyspepsia and general debility. Odina gum is used as an ointment with coconut milk and as a liniment with brandy for the application of sprains and bruises. Odina wodier is also used as a gargle in aphthous conditions of the mouth and for a toothache. Fresh juice of the bark is used on eye sores and obstinate ulcers. Powdered bark mixed with neem oil is an application for chronic ulcers, skin diseases, and is also used as a paste for leprous ulcers. This work explores the biosynthesis of copper nanoparticles using the extract of Odina woider gum, and along these lines enhancing the significance of this plant source and of green chemistry in the possible production of different metal nanoparticles in future research [24,25]. Materials & Methods Materials All reagents utilized as a part of this study were procured from Sigma Aldrich Chemicals India. Double distilled water was used for this procedure. Filtration was built up by utilizing Whatman no.1 papers. Dishes and apparatus utilized for the total responses were washed and flushed with double distilled water and dried in a hot air oven. Arrangement of Odina woider Gum The Odina wodier gum was collected from Mannargudi and Tamilnadu, India. The collected gum was cleaned and then soaked in hot water until dissolved. The Odina wodier was then centrifuged to remove solid dust. Finally, the supernatant liquid gum was collected and used for the further synthesis of copper nanoparticles. The cleaned gums were dried under sunshade to completely expel dampness, powdered by utilizing the mechanical processor, and put away. A 5 gram portion of the powdered gums were placed into a measuring glass with 100 ml of refined water and permitted to bubble at 600C for 30 minutes under reflux condition, followed by being cooled off to room temperature. Preparation of CuNPs A 25-ml portion of leaf concentrate was slowly added to 100 ml of 1mM (0.001M) solution of copper sulfate with constant stirring [26]. After the total addition of gum concentrate, the blend was kept under incubation for 24 hours. Within a specific time, the solution changed from a shade of green to straw yellow, demonstrating the development of copper nanoparticles. At that point, the solution was centrifuged for 15 minutes at 10,000 rpm and scattered in double distilled water to expel any undesirable natural materials [27,28]. Characterisation The development of copper nanoparticles was confirmed using UV-Visible spectroscopy, utilizing a Jasco V-550 spectrophotometer instrument. The size of the CuNPs was determined by scans in the range of 300-700 nm. To decide the biomolecules’ availability of CuNPs in the extracts, FTIR scans were made between 400 and 4000 cm-1. The specimen was centrifuged at 9500 rpm for 20 min, dried utilizing a hot air stove, and ground with KBr to shape a pellet. At that point, the pellet was examined utilizing a Jusco 5300 model FTIR instrument. The crystalline structure of the copper nanoparticles was clarified using X-Ray diffraction examination utilizing a Rigaku X-Ray diffractometer (Miniflex, UK) instrument working at 40 kV with 2 sec time interim at room temperature (270C). The mean size of the crystalline Cu and Cu2O nanoparticles were calculated by the following correlation:
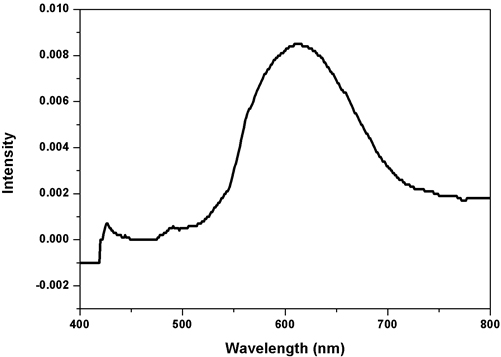
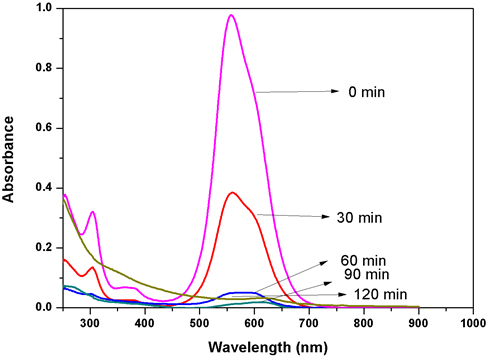
where D is the average size of crystallite, K is the Scherrer constant with a value from 0.9 to 1, λ is the wavelength of the X-Ray source (0.1541 nm) used in XRD, β is the full width at half maximum of the diffraction peak, and θ is the Bragg’s angle. Morphology and mean molecule size of the CuNPs were evaluated by SEM and TEM examination. The specimens were set up for SEM and TEM examination. The SEM investigation used a Supra Zeiss with 1 nm determination at 30 kV with 20 mm Oxford EDS finder. The basic arrangement in the response blend was dictated by EDX examination. The TEM investigation was completed utilizing a HITACHI H-7650 at a working voltage of 80 kV. Evaluation of the Photocatalytic Activity of Copper Nanoparticles: The photocatalytic activity of the green synthesized copper nanoparticles was evaluated by using the aqueous solution of an acid blue dye. It was performed by the addition of CuNPs to 10 ml of the dye solution, and the suspension was subjected to irradiation under sunlight. The aqueous suspension was magnetically stirred throughout the experiment. At different time intervals an aliquot was removed, the absorption spectra was recorded, and the rate of decolourization was determined in terms of change in intensity at λmax of the dyes. The decolourization efficiency % has been calculated as where Co=Initial concentration of dye and C=Concentration of dye after photoirradiation. Results & Discussion UV-Visible spectroscopy study The results of the UV-Visible spectroscopy examination of the specimen are shown in Figure 1. It is the best technique for examination to identify CuNPs by the Surface Plasmon Resonance [29,30]. The CuNPs development was affirmed from the crest at 600nm, which is the surface Plasmon resonance band of copper nanoparticles, this outcome agrees with Curtis et al. The peak maximum was observed to slowly diminish as size increased. Copper SPR impacts diminish with the time due to the oxidation of the produced copper nanoparticles [39].
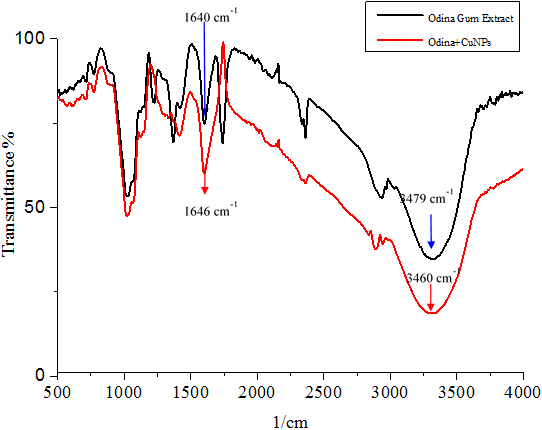
FTIR Study The FTIR estimation of plant concentrate and copper nanoparticles are provided in Figure 2, a-Odina Gum extract and b-Odina Gum +CuNPs. The FTIR examination was utilized to distinguish between the Odina woider gum and CuNPs. In Figure 2 (a), Odina woider gum separation demonstrated top peaks at 3851, 3479 and 1640 cm-1. The top absorbance at 1640 cm-1 was expected to agree with C=O stretching [31], the peak of 3479 cm-1 for O-H stretching of phenolic compounds [32]. The O-H stretching of hydroxyl groups absorbs at 3851 cm-1 [33]. In Figure 2 for copper nanoparticles, absorbance at 3901, 3840, 3852, 3460, and 1636 cm-1 were observed. Peaks at 1636 and 3460 cm-1 corresponded to C=O stretching of amides and O-H stretching of a phenolic compound, respectively. Alternate peaks seen in the copper nanoparticle spectra are 3852, 3840, and 3901 cm-1 due to O-H stretching alcohols and phenols [1]. The FTIR examination of CuNPs recommended that they might be encompassed by natural particles (e.g., polyphenols, alkaloids, and terpenoids); Kalainila et al. reported similar results [37]. The substance constituents display in plant leaves concentrate; for example, flavonoids, alkaloids, and unsaturated fats are in charge of reducing copper particles to copper nanoparticles because of their capping and limit reducing abilities.
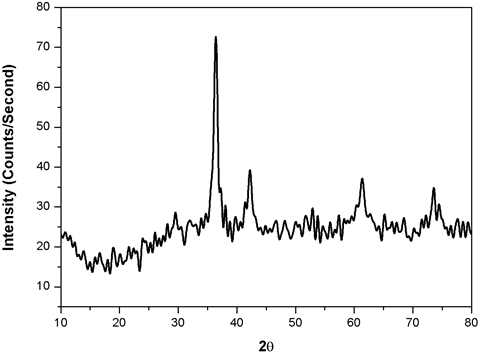
XRD Examination Figure 3 shows the XRD examination of the copper nanoparticles. The figure shows the two diverse diffraction tops at 2θ =39.10, 430, 68.30, and 730. These diffraction crests alluded to the attributes of cubic focused CuNPs. Diffraction crests got to 2θ edge compared to (111) and (113) mill operator index [26]. To decide the normal molecule size of the CuNPs, the Debye-Scherrer equation is utilized. The crystal structure and size of the nanoparticles are verified by XRD analysis. Peaks observed at 2θ with values of 42.47, 51.73, and 73.42 correspond to (111), (200), and (220) planes of metallic Cu. These three peaks are quite consistent with those of the standard JCPDS Card No. 04-0836 for the standard spectrum of the pure FCC, face centered cubic, metallic Cu. Besides the metallic Cu peaks, several other diffraction peaks appeared at 36.43, 61.58, 73.42, and 77.19 corresponding to (111), (220), (311), and (222) planes of cuprite, respectively, indicating the formation of cubic copper (I) oxide nanocrystals. XRD peaks observed for cuprite is matched well with the standard powder diffraction card of bcc (body centered cubic) cuprite (JCPDS No. 05-667). The mean size of the crystalline Cu and Cu2O nanoparticles calculated from the major diffractions peaks using the Scherrer formula is about 28.73 and 25.19 nm, respectively.
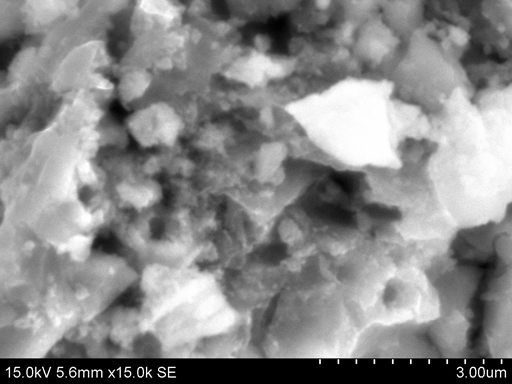
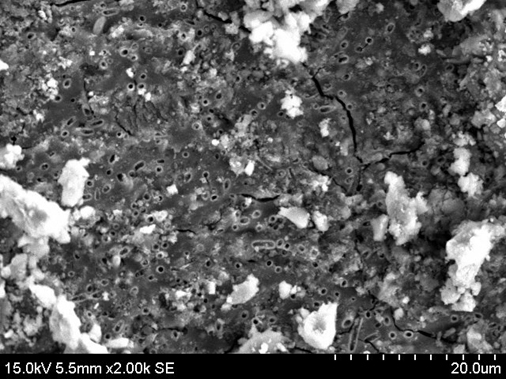
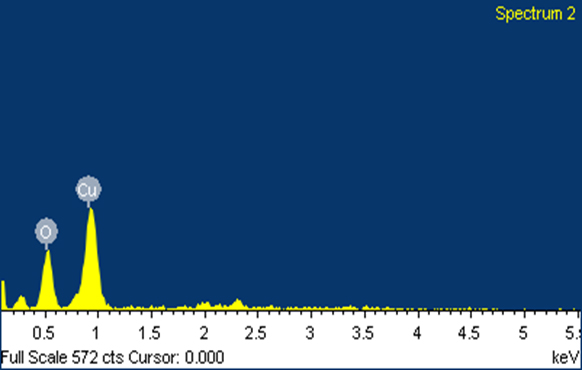
SEM Analysis The surface morphology and size of the nanoparticles were acquired by Scanning Electron Microscopy (SEM) examination. Figures 4 (a) and 4 (b) show the CuNPs incorporated by the plant concentrate of Odina wodier. The electrostatic collaborations and a hydrogen bond between the bio-natural capping atoms bond are in charge of the union of copper nanoparticles utilizing plant extract. It was demonstrated that circular and generally uniform state of the copper nanoparticles was affirmed in the range of 60-100 nm. Due to the Surface Plasmon Resonance, the copper nanoparticle demonstrated the retention peak of higher counts [34]. The quantitative examination of components of CuNPs is investigated by EDAX examination in Figure 4 (c).
The EDX spectrum confirms the formation of biosynthesized copper nanoparticles, while Figure 4 (c) and Table 1 confirm the composition of synthesized copper nanoparticles.
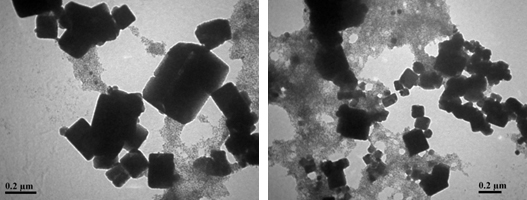
TEM Investigation The shape and size of the developed CuNPs were broke down by TEM examination [35]. Figure 5 demonstrates the TEM representation of biosynthesized CuNPs. The developed CuNPs were cubical fit with particle size estimate in nanoscale. The green synthesized copper nanoparticles’ size profoundly relies upon the concentration of Odina gum extract. It was affirmed that the concentration of leaf concentrate was observed to increase with the decline in particles size [36,37].
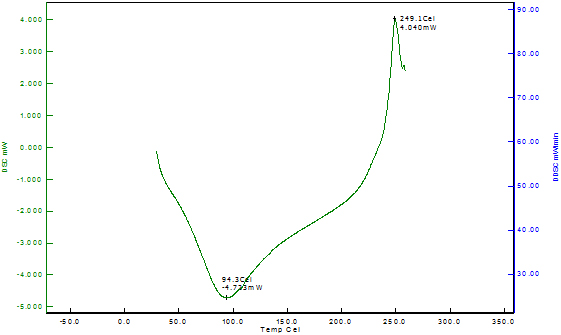
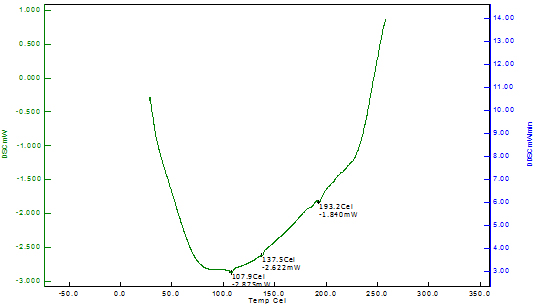
Differential Scanning Calorimetry of Copper Nanoparticles The thermal stability of the copper nanoparticles was explained by differential scanning calorimetry of copper nanoparticles shown in Figure 6. The DSC analysis gives the glass transition temperature which is defined as the peak temperatures in the heating curve. The DSC curve indicates that the copper nanoparticles reach the first exothermic peak at 249.10C, beginning at 94.30C; this is due to the oxidation of copper into cuprous oxide. The DSC thermogram of Odina gums show the glass transition temperature at 193.20C. However, no data for glass transition temperature for Odina gum is reported in the literature.
Dye Degradation by Copper Nanoparticles Catalysis occurs only on the surface of metals, hence increasing the available surface area of the nanoparticle will greatly enhance the effectiveness of the catalyst. Decreasing the particle size will increase the catalytic activity, but there is a critical size below which further decreases will hinder the catalytic activity [22]. Metal nanoparticles help in the electron transfer from the donor to the acceptor. Nanoparticles possess a large surface area which acts as a substrate for the electron transfer reaction. Just before the electron transfer reaction, both of the reactants are adsorbed into the metal surface. Subsequently, the reactant gains an electron and is reduced.
Organic-based dyes are one of the major categories of pollutants from the textile and leather industries. These industries produce a large quantity of high content dye effluents, which are highly toxic and very resistant to destruction and degradation in the waste water by a variety of conventional methods. A necessary criterion for the use of these dyes is that they must be highly accumulated in water and stable in light during washing. The accumulation of these dyes in the water causes eutrophication and the reduction of the reoxygenation capacity, and results in severe damage to the aquatic organisms by hindering the infiltration of sunlight [43]. The dye enriched wastewater could be resistant to microbial degradation. Therefore, they are not readily degradable and are typically not removed from water by microbiological treatment systems, biotechnological treatment systems, or conventional methods such as adsorption, ultrafiltration, and chemical and electrochemical methods [44]. Recently, it was reported that metallic nanoparticles were used for the treatment of dye containing wastewater by photo-oxidation. These metallic nanoparticles have low cost, high stability, and act as a photocatalyst for the treatment of dye wastewater. Moreover, metal nanoparticles provide a reduced size, defined shape, large surface area to volume ratio, and mass enhanced reactivity; these properties lead to high photocatalytic activities for degradation of dye wastewater. Currently, green synthesized nanoparticles are used as a catalyst for photo-oxidation for the treatment of dye wastewater. Newly, Copper nanoparticles are considered as a catalyst for photo-oxidation of wastewater and it has several advantages such as low cost, extensive availability, and suitability for numerous applications, including electrical applications, catalysis, sensors, inkjets, and field emission emitters. The bio-synthesised CuNPs act as a photocatalyst for removal of Acid Blue 120, a toxic dye, in the water. Acid Blue 120 is a hazardous substance and a water-soluble heterocyclic aromatic chemical compound used as colourant in the dyeing process of leather, paper, and biological shading. Due to its harmful effect, the complete removal of Acid Blue 120 from the water is necessary.
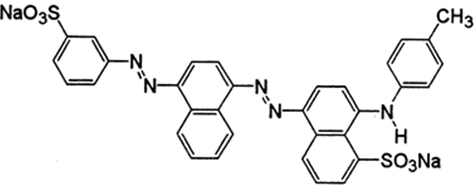
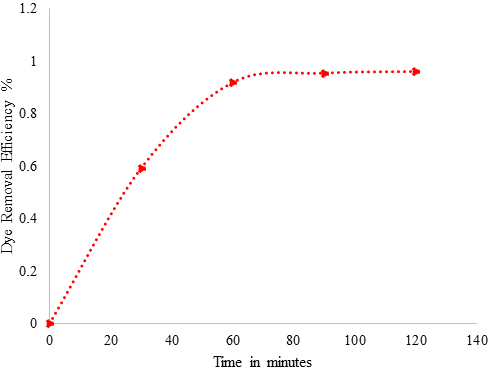
The structure of Acid Blue 120 is shown in Figure 8. Acid Blue 120 consists of heterocyclic aromatic rings and an azo group. The Acid Blue 120 was used for evaluating photocatalytic activity of CuNPs in an aqueous medium under solar irradiation. The degradation of dye did not immediately occur in the reaction medium. The reaction was monitored by the change in the absorbance observed in the UV spectrum of the reaction mixture after centrifugation to remove the CuNPs. It was observed that as the exposure time increased, the absorption corresponding to Acid Blue 120 depreciated gradually from 0.98 until it reached its minimum value of 0.039. In Figure 6, the absorption peaks at 560 nm, corresponding to Acid Blue, showed rapid degradation and disappeared after 120 minutes. To confirm the photocatalytic activity of the CuNPs, a control experiment was carried out. It was noticed that when the dye solution was kept under sunlight, in the absence of NPs, the dye did not undergo any degradation in the reaction medium. Figure 9 depicts the degradation potential of the synthesized CuNPs for Acid Blue 120, which reached 96%. It was observed that the rate of reaction control, within 60 minutes, reached an equilibrium that followed the first order kinetics for photodegradation of Acid Blue 120.
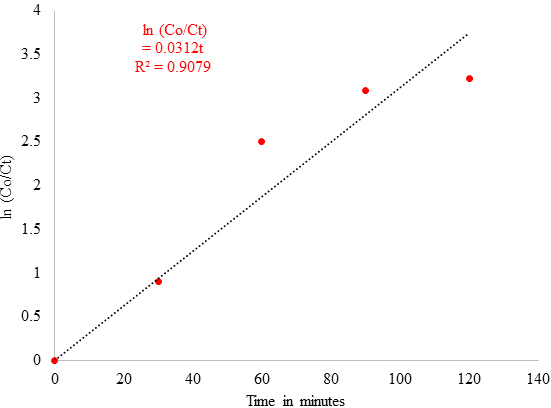
The degradation rate of dyes with metallic nanoparticles obeys first order reaction kinetics and its correlation is given by
where Co = Concentration of dyes at the initial time of reaction, Ct = Concentration of dyes at time t after reaction progress, k = first order rate constant of the photochemical reaction, and t = reaction time in minutes.
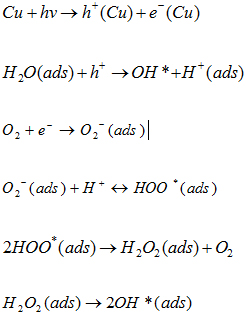
Figure 10 confirms a linear relationship between ln (Co/Ct) and irradiation time with a 3.12 x 10⁻² min-1 rate of reaction. Thus, it confirmed that green synthesised CuNPs can be a potential photocatalyst for the effective removal of Acid Blue 120 dyes in the wastewater. Photocatalytic Mechanism of CuNPs The photocatalytic mechanism of CuNPs consists of two main parts. The first part of a photochemical reaction is based upon the interaction with light associated with photon absorption, charge creation, dynamics, and surface trapping. The second part of the reaction is controlled by surface reactivity and surface radical formation, such as the formation of H2O, O2, and Organic Pollutants [41]. The Photocatalytic mechanism of CuNPs can be summarised as below:
The complete degradation reaction can be explained by the following chemical reactions:
Conclusion This investigation indicated a simple method for synthesis of CuNPs and its applications in waste water treatment. Dye degradation in the absence of metallic nanoparticles in biological, chemical, and physical remediation results in dye recycling, poor degradation, and retention of same toxicity. In the case of Photocatalytic degradation, treatment with nanoparticles as a photocatalyst is a novel approach for complete removal of dye from the wastewater. The metal oxide nanoparticles, such as Tin Oxide (SnO2) and Titanium Oxide (TiO2), utilized as photocatalysts for the treatment of dyes within wastewater were shown to be highly effective [45]. This study confirmed that Copper nanoparticles provide high surface areas and a large number of active sites without the doping of any semiconducting materials. The present investigation showed a 96% removal of dye with CuNPs, which were synthesized by Odina gum extract, showing it to be an effective process. References
|
||||||||||||||||||||||||||||||||||||||||||||||||||||||||||||||||||||