|
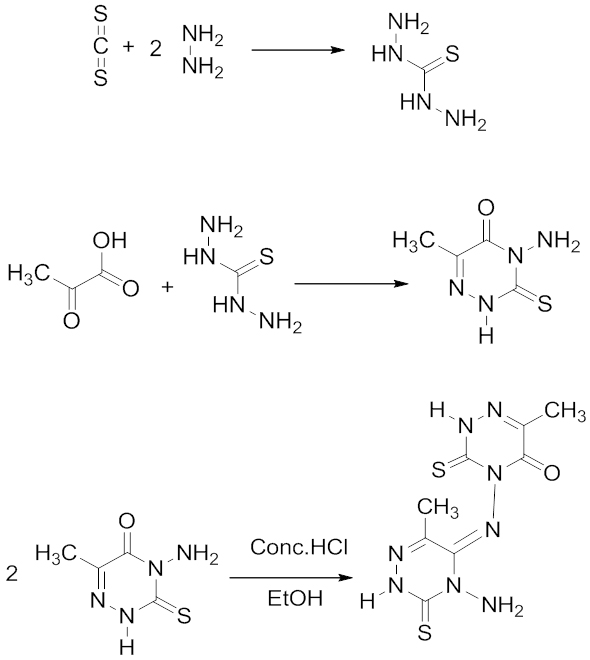
Introduction Selection of an effective corrosion inhibitor is very important to protect metals and metal based objects, when it is exposed to acidic or alkaline environment. Copper is a noble metal with valuable properties such as high electrical conductivity and thermal conductivity, but it undergoes corrosion in acidic and strong alkaline media. Most of the time tested inhibitors are aromatic compounds containing N, S, O, and P atoms or systems with conjugated pi electron network. The heterocyclic compounds which contain N, S, and O atoms can also form chelates with metal and form a film on the surface, which in turn prevents the attack of H+ ions, and resists corrosion [1-8]. Schiff base is another class of compounds which can act as inhibitors due to the presence of electron rich groups like >C=N- and their inhibiting efficiency is more encouraging than corresponding aldehydes and amines [9-10]. The blocking of metal surface from the corrosive medium is mainly by the adsorption of inhibitor molecules on the metal surface. The adsorption ability of metals depends on the nature and surface charge of the metal, chemical composition of electrolytes, molecular structure, and electronic characteristic of inhibitor. The process of adsorption may be of different types, (1) electrostatic attraction between charged molecules and charged metal, (2) interaction of unshared electron pairs in the molecules with metal, (3) interaction of p electron with metal, and/or (4) combination of all these processes [11-12]. Recently, some triazine molecules and their derivatives were reported to act as good corrosion inhibitors for mild steel and copper. The choice of these compounds was based on the inherent properties they possess like π-electron conjugation, abundance of heteroatom, ability of coordination, and adsorption on to copper metal [13-15]. The present study aims to investigate the effect of inhibitor, (E)-4-((4-amino-6-methyl-3-thioxo-3,4-dihydro-1,2,4-triazin-5(2H)-ylidene)amino)-6-methyl-3-thioxo-3,4-dihydro-1,2,4-triazin-5(2H)-one, a triazine dimer on copper corrosion in 0.5M, 1M and 2M HCl solutions, using electrochemical techniques such as electrochemical impedance spectroscopy and Tafel polarization. The mechanism of inhibition was ascertained by scanning electron microscopy and adsorption studies. In order to investigate the relationship between the inhibitor efficiency and structure of the molecule, some quantum chemical parameters such as HOMO and LUMO energies, charge density on adsorption center, and dipole momentetc have been calculated. Experimental Methods Synthesis of Inhibitor Molecule AMTDT The inhibitor molecule, AMTDT, was synthesized by a three stage reaction. In the first stage, carbon disulfide (E. Merck Germany) reacted with hydrazine mono hydrate (E. Merck) to form thiocarbohydrazide. The thiocarbohydrazide reacted with 2-oxopropionicacid (E. Merck) which led to the formation of [4- amino 3-mercapto 6-methyl -1, 2, 4-triazin 2(H)- 5one] in the second stage [16-17]. At the final stage, [ 4- amino 3-mercapto 6-methyl -1,2,4-triazin 2(H)- 5one] dimerized to form (E)-4-((4-amino-6-methyl-3-thioxo-3,4-dihydro-1,2,4-triazin-5(2H)-ylidene)amino)-6-methyl-3-thioxo-3,4-dihydro-1,2,4-triazin-5(2H)-one in the presence of conc. HCl and ethanol under reflex for 4 hours. The product was re-crystallized from alcohol and characterized by spectral and elemental analysis. The compound was soluble in HCl and was used for the investigation. Synthesis of AMTDT is shown in Scheme 1. Material and Medium The copper specimens of dimensions 2.8x1.9cm2 were selected and polished with different grade emery papers followed by washing with water and acetone and were used in electrochemical measurements. The test solution was prepared from reagent grade HCl (E. Merck) and distilled water [18]. All the tests were performed in aerated medium at room temperature (303K) and high temperatures (313K and 323K).
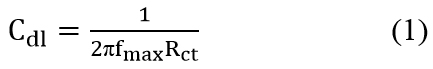
Electrochemical Measurements The electrochemical measurements were carried out by a computer controlled electrochemical work station (ACM, UK model no.1745). It consisted of a three electrode corrosion cell with platinum foil (1 cm2 surface area), used as the auxiliary electrode, and saturated calomel electrode (SCE) as the reference electrode. The working electrode was a copper metal piece, which was immersed in the test solution firstly. Prior to the electrochemical measurements, a stabilization period of 60 minutes was allowed to attain a stable value of Ecorr [19]. The electrochemical impedance measurements were carried out in a frequency range of 0.01 to 1000 Hz, with amplitude of 5mV. The impedance diagrams were plotted in the Nyquist representation. The double layer capacitance (Cdl) calculated [20] from the equation:
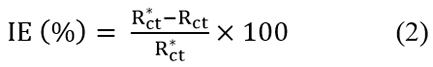
where fmax is the frequency at which the imaginary component of impedance is maximum. The percentage inhibition efficiency (IE %) was calculated from charge transfer resistance by the equation:
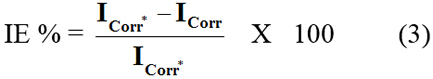
where R'ct and Rct are the charge-transfer resistance in the presence and absence of inhibitor AMTDT. The potentiodynamic polarization was carried out from the cathodic potential -250mV verses Ecorr to anodic potential of +250mV verses Ecorr, with a scan rate 1mV/s. The linear Tafel segments of the cathodic and anodic curves were extrapolated to corrosion potential, to obtain the corrosion current densities, which were used to calculate inhibition efficiency. The percentage inhibition efficiency was calculated from the equation of polarization measurements:
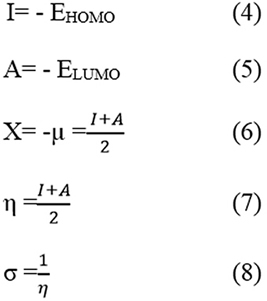
where Icorr* and Icorr are the corrosion current densities of the inhibited and uninhibited copper metal. Surface Characterization The scanning electron microscopy measurements of the metal specimens were done in Hitachi SU 6600, instrument at an accelerating voltage 20.0Kv and at a 500X magnification. The metal specimens were immersed in acid solution containing optimum concentration of inhibitor for 4 hours, and then removed, rinsed with acetone and dried, and used for measurements. Computational Studies The quantum chemical calculations were performed with complete geometry optimization of the inhibitor molecule using density functional theory at B3LYP/6-31G* level and the frequency calculation was also done with the same level of DFT to get energy minima using Gaussian 03 software package. The energies of the frontier molecular orbital (HOMO and LUMO) can be used to calculate and interpret the adsorption characteristics of the inhibitor molecule. According to Koopman’s theorem, the following theoretical relations can be arrived between the chemical potential of molecule, such as ionization potential, electron affinity, electronegativity, hardness, softness, and corresponding Frontier molecular orbitals, and have been well established in conceptual density functional theory [21].
The fraction of electro transferred from the inhibitor to the metal surface can be predicted as:
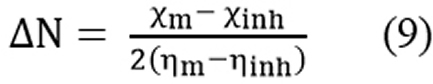
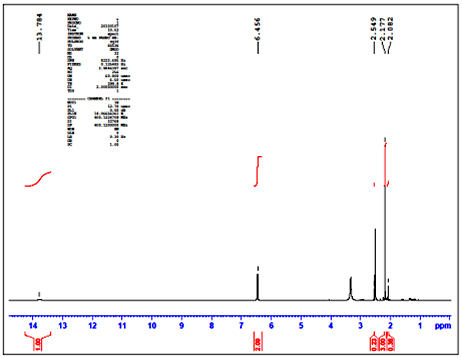
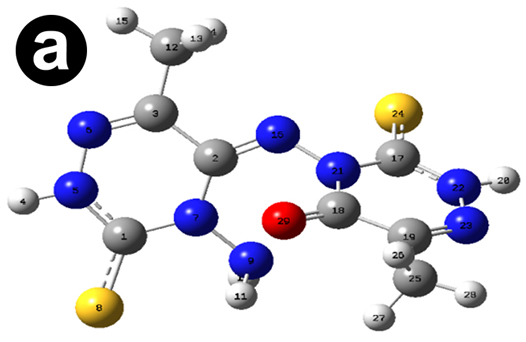
where χm and χinh represents the electro negativity of Fe and inhibitor molecule and ηm and ηinh are the hardness of the metal and inhibitor, respectively. Theoretically, we assume that the value of χFe is 7.0eV and ηFe is zero. Results & Discussion Characterization of (E)-4-((4-amino-6-methyl-3-thioxo-3, 4-dihydro-1, 2, 4-triazin-5(2H)-ylidene) amino)-6-methyl-3-thioxo-3, 4-dihydro-1, 2, 4-triazin-5(2H)-one The synthesized inhibitor AMTDT was characterized by elemental analysis, FTIR, 1H NMR, and Mass spectra. CHNS (%) found (calculated) C: 32.34 (32.21), H: 2.63 (3.38), N: 37.62 (37.58), S: 19.11 (21.47). FTIR (KBr); υ= 1662cm-1 (C=N- stretch), 1235 and 891cm-1 (C=S stretch), 1128 cm-1 (N-N stretch), 2907cm-1 (C-H stretch), 3216 cm-1 (N-H stretch). The 1HNMR spectrum of AMTDT in dmso-d6, (Fig.1) shows the chemical shifts (δ/ppm) at δ = 6.45ppm assignable to secondary N-H proton. A singlet of three protons at δ = 2.17ppm was assignable to methyl protons. Mass spectrum of AMTDT was recorded HRMS-FAB method and is represented in Fig.2. It shows the molecular ion peak at m/z 298.68 (41%) with a base beak atm/z 215.21 (100.00%). This is in addition to the other significant peaks at m/z 197.25 (60%), 280.23 (67%), 109 (63%), 179.24 (30%), 149.23 (39%).
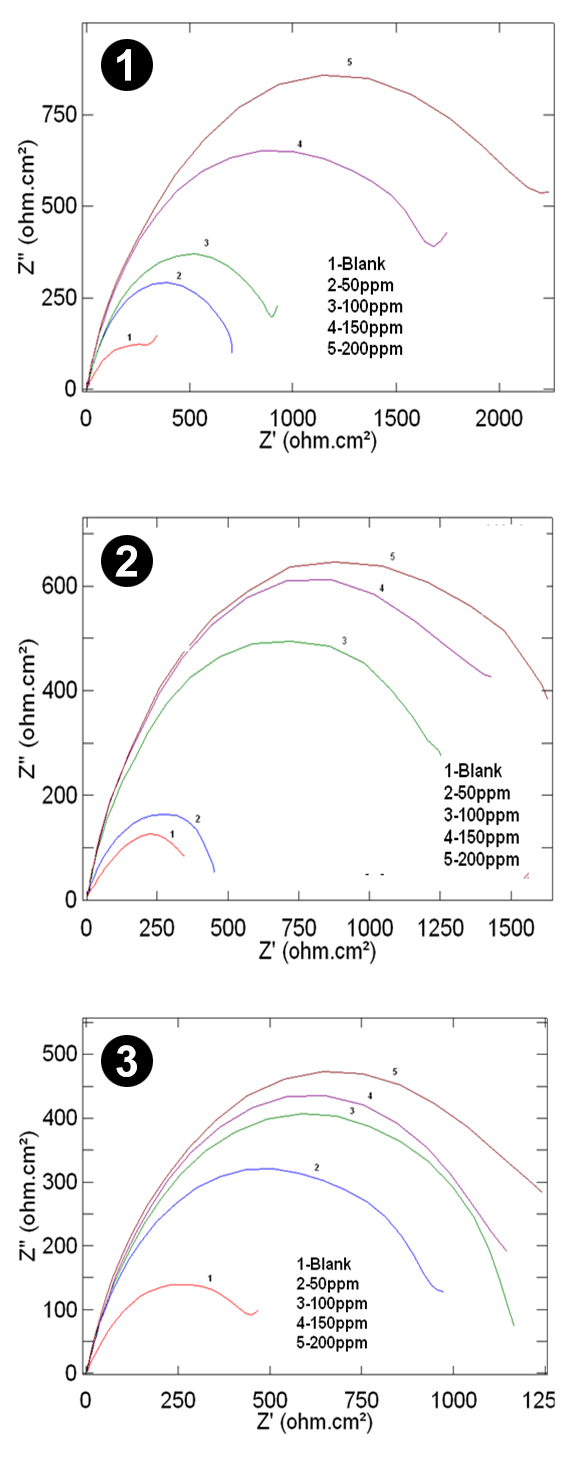
Electrochemical Impedance Spectroscopy (EIS) The impedance measurements were carried out after an immersion time of one hour in 0.5M, 1M and 2M HCl solutions at 303K, 313K, and 323K in the presence and absence of different concentrations of AMTDT. The results were recorded as Nyquist plots. It contains semicircles whose size increases with increasing inhibitor concentration and a representation corresponding to 303K is given in Fig.3. The corresponding electrochemical parameters, namely the charge transfer resistance (Rct), double layer capacitance (Cdl), corrosion rate (CR mils/year), and percentage inhibition efficiency were calculated. Among these the Rct, CR (mils/year), and percentage inhibition efficiency were listed in Tables 1, 2, and 3. The values of Rct and Cdl exhibit opposite trends over the entire concentration range. The Rct values increased with increasing inhibitor concentration, which indicates considerable surface coverage by the inhibitor and a bonding between the surface of the metal to the inhibitor [22].The decrease in Cdl value suggests that strong adsorption of the inhibitor on the surface of copper, which revealed that an increase in the thickness of the protective layer. The mechanism of adsorption involves blocking of reaction sites on the surface by adsorbing the inhibitor [23-26], which increases with concentration of inhibitor and decreases with temperature. But at higher temperature 323K, the Cdl values indicate that there is a weak adsorption on the metal.
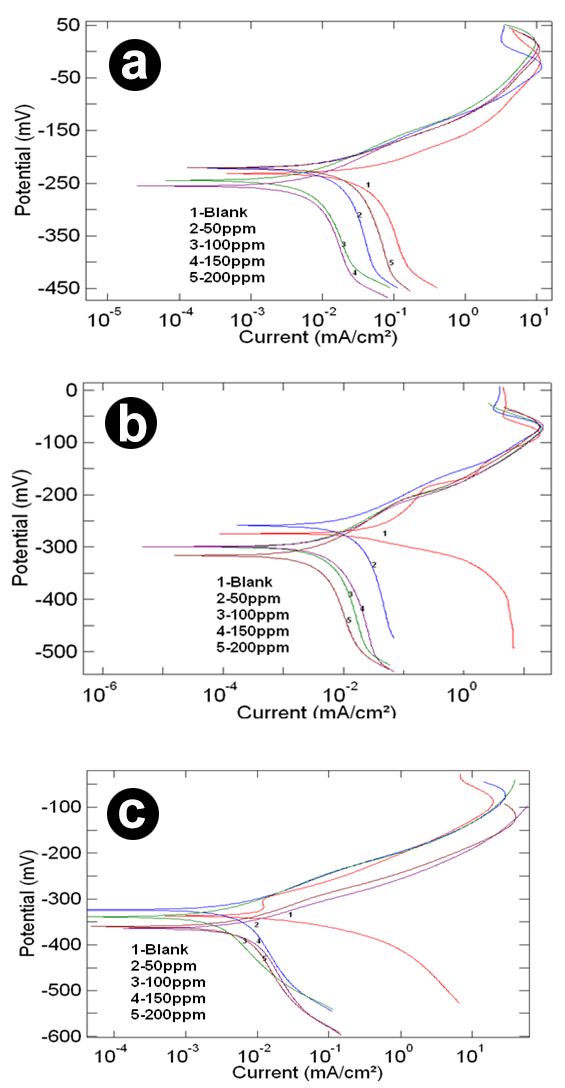
Tafel Polarization The potentiodynamic polarization curves for copper in 0.5M, 1M, and 2M HCl solutions at 303K, 313K and 323K in the presence and absence of inhibitor AMTDT were recorded, and presentation corresponding to 303K shown in Fig.4. The electrochemical parameters, such as corrosion potential (Ecorr), corrosion current density (Icorr) cathodic and anodic Tafel slopes (βa and βc), were obtained from the Tafel polarization plots, in which Icorr, and CR (mils/year) were listed in Tables 1, 2, and 3. The inhibition efficiency of AMTDT increases with increasing concentration, which is the major result of polarization study and is parallel to the EIS result. In the acidic solution, cathodic reaction is the discharge of H+ ions to hydrogen gas or reduced oxygen and the anodic reaction involves the passage of metal ion from the metal solution. Generally, an inhibitor might affect either anodic or cathodic reactions or both in some cases. But in this case, the inhibitor AMTDT effect anodic and cathodic curves of polarization and shifted both to lower current densities and AMTDT act as a mixed type inhibitor [27]. The investigation of the effect of temperature on the inhibitor has led to an important observation. The solubility of the inhibitor is low at room temperature. Therefore, at higher temperature (313K) a more effective protective layer is formed on the surface of the metal. This explains the increased efficiency of the inhibitor at 313K. But when the temperature was further increased to 323K, the efficiency was found to decrease. The adsorption of inhibitor molecules on the metal surface can be considered as a combination of physisorption and chemisorptions, with physisorption as the major contributor. The effect of physisorption decreases with increasing temperature. Therefore, as the temperature was increased, efficiency of adsorption of inhibitor molecules on to the metal surface would decrease. This explains the low inhibition efficiency of the inhibitor at 323K [28]. Thus, 313K is the optimum temperature for the inhibitor AMTDT.
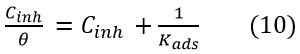
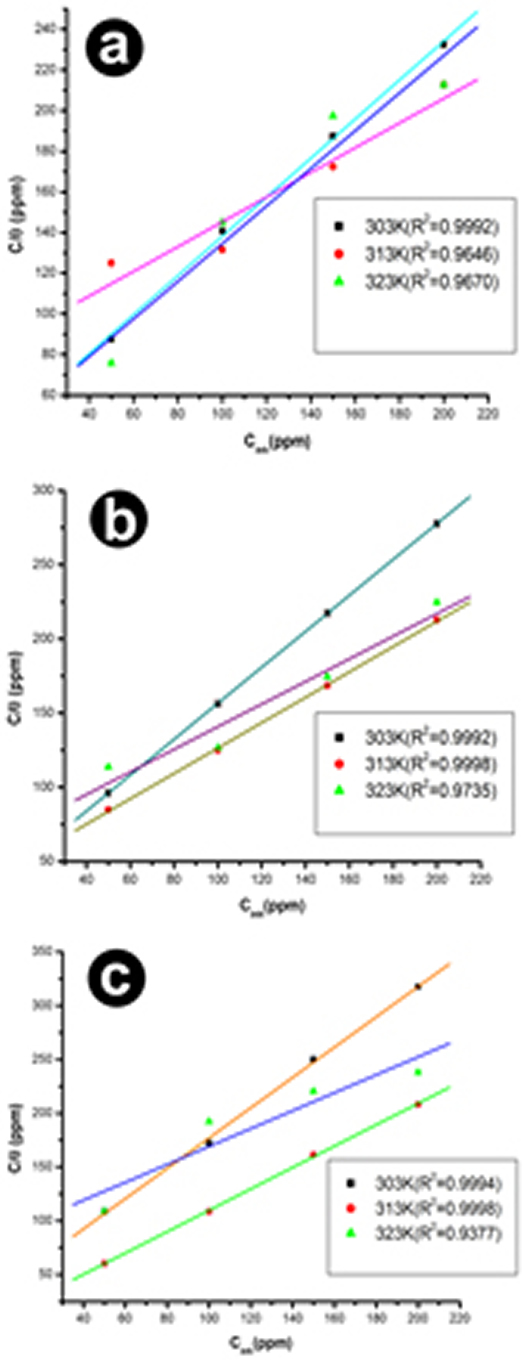
Adsorption Studies The metal surface adsorbs the inhibitor, thus it can accelerate the reaction kinetics either by adsorbing the available surface area for corrosion or by modifying the electrochemical standard Gibbs free energy of activation [29]. Surface coverage θ, for different concentration of inhibitor 0.5M, 1M, and 2M HCl solutions at 303K, 313K, and 323K have been obtained from potentiodynamic polarization measurements. The relationship of C/θ (ppm) verses Cinh (ppm) in Fig. 5 suggests that the adsorption of AMTDT on copper followed the Langmuir adsorption isotherm, which is the best fit. The isotherm can be represented as:
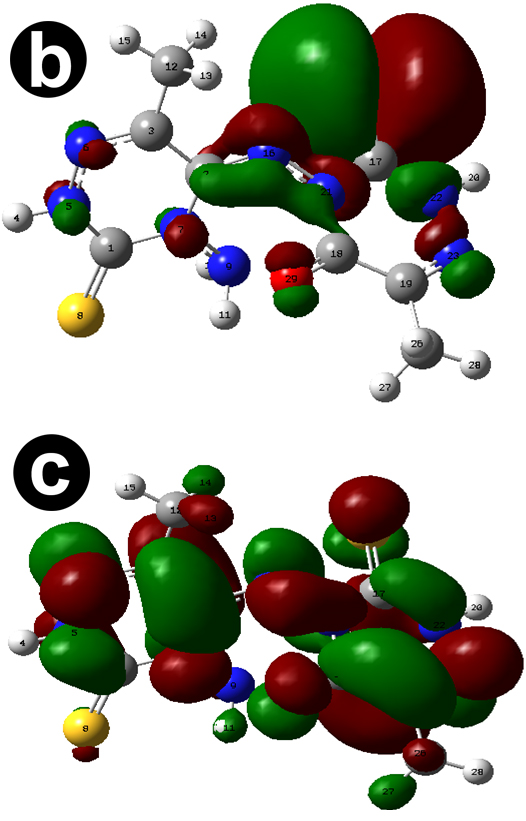
where Cinh is the concentration of inhibitor in mol/L and Kads is the equilibrium constant of adsorption. The standard Gibbs free energy of adsorption ΔG0ads and adsorption constant (Kads) related by the equation: The negative values of ΔG0ads indicate the stability of the adsorbed layer on the copper surface and spontaneity of the process [30]. The perusal of ΔG0ads ranges from -29 to -38KJ/mol, which suggest that the adsorption of AMTDT follows two types of interactions: physisorption and chemisorptions [31]. Computational Studies In the AMTDT, all the experimental results were in good agreement with theoretically predicted results generated at the B3LYP/6-31G* level of DFT. The inhibition efficiency of an inhibitor depends on the molecular structure of that inhibitor [32]. The degree of corrosion inhibition was correlated with energy of highest occupied molecular orbital (EHOMO), lowest unoccupied molecular orbital (ELUMO), energy gap (ΔE=ELUMO-EHOMO), the dipole moment (μ), and ionization potential (I). The ionization potential of a molecule, which is closely related to EHOMO, higher value of EHOMO (-6.0873 eV), indicates the tendency of AMTDT to donate an electron to the acceptor copper surface, and facilitate the adsorption and therefore, enhance the inhibition efficiency. Similarly, the lower value of ELUMO (-2.1832 eV) indicates the ability to accept an electron from AMTDT and hence, possible better inhibition efficiency [33]. The theoretical models for explaining structure and conformation barrier in the molecular system can be obtained by the energy gap of the inhibitor (ΔE=ELUMO-EHOMO). The lower gap of LUMO-HOMO of AMTDT also supports the better inhibition efficiency [34]. The lower value of chemical softness (0.5123) confirms higher reactivity of AMTDT [35-36].
The dipole moment of AMTDT (1.3883 D) indicating polarity reveals the ability to donate electrons to the metal surface. The fraction of electron transferred from the AMTDT to the mild steel surface showing the higher inhibition efficiency of AMTDT. The theoretical parameters and chemical reactivity descriptors such as ionization potential, electronaffinity, hardness, and softness are demonstrated in Table 4. The optimized geometry, HOMO, LUMO of AMTDT are given in Figure 6.
The condensed atom fukui functions for electrophilic and nucleophilic attack were calculated and given in Table 5. It is clear that the most reactive electrophilic sites are S(24), C(17), N(16), and N(23) and most reactive nucleophilic sites are N(6), C(2), and N(23). Thus, it can be concluded that the data obtained from theoretical study were in agreement with that obtained from electro analytical studies.
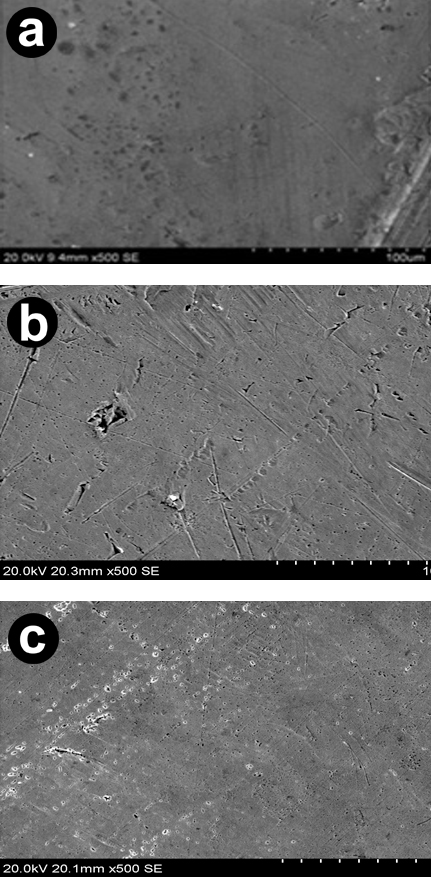
SEM Analysis The scanning electron microscopic images of the surface of copper samples were recorded in order to observe the changes that occurred during the corrosion in the absence and presence of AMTDT. The Fig.7 (a) shows the bare copper. Fig.7 (b) shows highly damaged copper specimens due to the direct attack of 0.5M HCl solution. It is clear that the surface of copper was highly corroded in the aggressive acid media. The Fig.7 (c) shows a smooth surface with the inhibitor on the surface of the copper after the addition of 200ppm inhibitor in 0.5M HCl solution. The results reveal that the protective layer formed on the surface, by means of adsorption or coordination, acts to offer excellent corrosion protection properties on 0.5M HCl solution.
Conclusions
References
|
|||||||||||||||||||||||||||||||||||||||||||||||||||||||||||||||||||||||||||||||||||||||||||||||||||||||||||||||||||||||||||||||||||||||||||||||||||||||||||||||||||||||||||||||||||||||||||||||||||||||||||||||||||||||||||||||||||||||||||||||||||||||||||||||||||||||||||||||||||||||||||||||||||||||||||||||||||||||||||||||||||||||||||||||||||||||||||||||||||||||||||||||||||||||||||||||||||||||||||||||||||||||||||||||||||||||||||||||||||||||||||||||||||||||||||||||||||||||||||||||||||||||||||||||||||||||||||||||||||||||||||||||||||||||||||||||||||||||||||||||||||||||||||||||||||||||||||||||||||||||||||||||||||||||||||||||||||||||||||||||||||||||||||||||||||||||||||||||||||||||||||||||