|
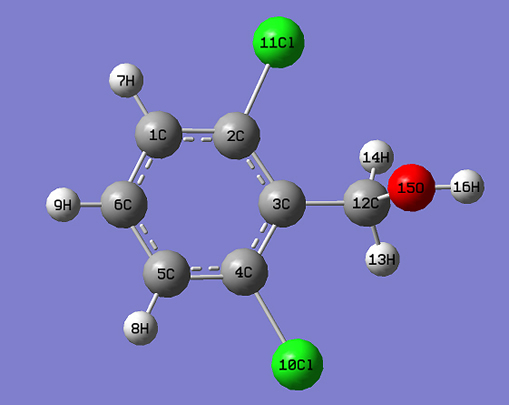
Introduction Benzyl alcohol derivatives are found in natural products and play a central role in numerous mechanistic investigations [1]. Aminobenzyl alcohols are useful as antimicrobial agents [2] and herbicides [3]. 3-Aminobenzyl alcohol is used to synthesize gamma-L-glutamyl-4-nitroanilide derivative to determine γ-GTP (gamma-glutamyltranspeptides) in serum [4]. A hit-to-lead optimization program on dichlorobenzyl derivative discovers pyrimidine-5-carbonitrile-6-cyclopropyl as a functional antagonist of the human CXCR2 receptor and shows good oral bioavailability in the rat [5]. Alcohols are used in topical ophthalmic pharmaceuticals and are useful against cataracts [6]. In spite of these numerous applications and consequent interest in their qualitative and quantitative characterization, the vibrational spectra of benzyl alcohol derivative provide a deeper insight into their biological actions when they are administered as drugs and in the environment as herbicides. Several author groups have studied the vibrational spectra of benzyl alcohol derivatives [7, 8]. Experimental & Computational Details The FT-IR spectrum (Fig. 1) was recorded using KBr pellets on a DR/Jasco FT-IR 6300 spectrometer and the FT-Raman spectrum (Fig. 2) was obtained on Bruker RFS 100/s, Germany. Calculations of the title compound were carried out with Gaussian09 [9] program using the B3LYP/ 6-31G (6D, 7F) basis sets to predict the molecular structure and vibrational wave numbers. Molecular geometry was fully optimized by Berny’s optimization algorithm using redundant internal coordinates. Harmonic vibrational wave numbers were calculated using the analytic second derivatives to confirm the convergence to minima on the potential surface. The theoretical calculations were performed with the hybrid B3LYP functional that is, a combination of the Becke’s three-parameter exchange functional and Lee-Yang-Parr correlation functional [10, 11]. The DFT calculations reported excellent vibrational wavenumber of organic compounds if the calculated wavenumbers were scaled to compensate for the approximate treatment of electron correlation, for basis set deficiencies and for the anharmonicity [12]. The DFT hybrid B3LYP functional tended to overestimate the fundamental modes [13]; therefore, scaling factor of 0.9613 has to be used for obtaining a considerably better agreement with experimental data [14]. Then, frequency calculations were employed to confirm the structure as minimum points in energy. The absence of imaginary wavenumbers on the calculated vibrational spectrum confirmed that the structure (Fig. 3) deduced corresponded to minimum energy. The assignments of the calculated wave numbers were aided by the animation option of GAUSSVIEW program, which gave a visual presentation of the vibrational modes [15]. The potential energy distribution (PED) was calculated with the help of GAR2PED software package [16].
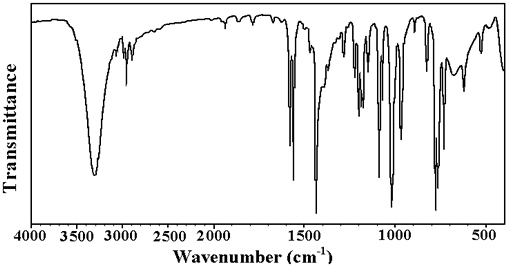
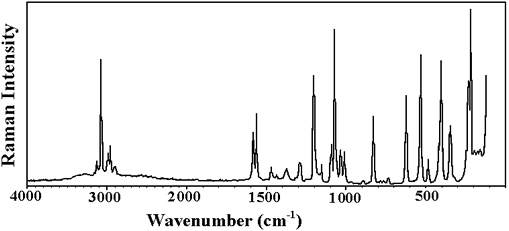
Results & Discussion IR and Raman Spectrum The calculated (scaled) wavenumbers, observed IR, Raman bands, and assignments are given in Table 1. Aromatic compounds commonly exhibit multiple weak bands in the region 3100-3000 cm-1, due to aromatic CH stretching vibrations [17]. For the title compound, the band observed at 3094 cm-1 in the Raman spectrum and at 3127, 3121, 3095 cm-1 (DFT) were assigned the CH stretching modes of the phenyl ring. For tri-substituted benzenes δCH modes were expected in the range 1050–1280 cm-1 [17] and the bands observed at 1214 cm-1 in the IR spectrum, 1071 cm-1 in the Raman spectrum and at 1230, 1184, 1066 cm-1 (DFT) are assigned as these in-plane CH deformation modes. The CH out-of-plane deformations were expected below 1000 cm-1 [18]. The bands at 971, 900 cm-1 in the IR spectrum, 900 cm-1 in the Raman spectrum and 980, 947, 909 cm-1 (DFT) were assigned as the CH out-of-plane deformations. The benzene ring possesses six ring stretching modes of which the four with the highest wavenumbers occurring near 1600, 1580, 1490, and 1440 cm-1 were good group vibrations [17]. These modes were expected in the region 1250-1620 cm-1 [17]. For the title compound, the bands observed at 1571, 1557, 1429 cm-1 (IR), 1578, 1437, 1294 cm-1 (Raman) and 1585, 1552, 1438, 1437, 1310 cm-1 (DFT) were assigned as the phenyl ring stretching modes.
In asymmetric tri-substituted benzenes, when all the three substituents were light, the wavenumber interval of the breathing mode was between 500 and 600 cm-1. In the case of mixed substituent, the wavenumber was expected to appear between 600 and 750 cm-1. When all the three substituents were heavy, the ring breathing mode was expected around 1100 cm-1 [19, 20]. The band observed at 729 cm-1 in the IR spectrum was assigned as the ring breathing mode of the phenyl ring which found support from the computational value at 720 cm-1. The asymmetric and symmetric CH2 stretching appeared in the region 3000±50 and 2965±30 cm-1, respectively [17, 18]. The CH2 stretching modes were observed at 2943 cm-1 in the IR spectrum and at 3000 cm-1 in the Raman spectrum. The DFT calculations gave these modes at 2987 and 2946 cm-1. The scissoring vibration δCH2 and wagging vibration ωCH2 appeared in the regions 1455 ± 55 and 1350 ± 85 cm-1, respectively [17,18]. The CH2 deformation band, which came near 1463 cm-1 in alkenes, [21] was lowered to about 1440 cm-1 when the CH2 group was next to a double or triple bond. The rocking mode [17] ρCH2 was expected in the range 895±85 cm-1. The deformation modes of the methylene group were assigned at 1507 cm-1 (scissoring), 1233 cm-1 (wagging), 1156 cm-1 (twisting), and 984 cm-1 (rocking) theoretically. For the hydroxyl group, the OH group provided three normal vibrations; the stretching vibration OH, in-plane and out-of-plane deformations δOH and γOH. The in-plane OH deformation [17] was expected in the region 1440 ± 40 cm-1. The out-of-plane deformation was expected generally in the region 650 ± 80 cm-1 [17]. The C-O stretching mode was expected in the region 1220 ± 40 cm-1 [18-20]. The OH modes were assigned at 3490 cm-1 (stretching), 1413 cm-1 (in-plane bend), and 599 cm-1 (out-of-plane bend) theoretically, for the title compound. Varghese et al. reported υOH at 3633 cm-1 and δOH at 1345 cm-1 theoretically and C-O stretching at 1255 cm-1 in both IR and Raman spectra and 1262 cm-1 theoretically [22]. For paracetamol, the C-O stretching mode and out-of-plane OH were reported at 1240 and 620 cm-1, respectively [23]. In the present case the C-O stretching mode was assigned at 1167 cm-1 in the Raman spectrum and at 1163 cm-1 theoretically. For simple organic chlorine compounds C-Cl absorptions were in the region 800-700 cm-1 [24, 25]. The bands observed at 829, 786 cm-1 in the IR spectrum, 794, 778 cm-1 in the Raman spectrum and at 808, 788 cm-1 (DFT) were assigned as the C-Cl stretching modes for the title compound. Most of the modes were not pure but contained significant contributions from other modes also. Nonlinear optical properties The first hyperpolarizability (β0) of this novel molecular system is calculated using the B3LYP/ 6-31G (6D, 7F) method, based on the finite-field approach. In the presence of an applied electric field, the energy of a system is a function of the electric field. The first hyperpolarizability is a third-rank tensor that can be described by a 3 × 3 × 3 matrix. The 27 components of the 3D matrix can be reduced to 10 components due to the Kleinman symmetry [26]. The components of β are defined as the coefficients in the Taylor series expansion of the energy in the external electric field. When the electric field is weak and homogeneous, this expansion becomes: where E0 is the energy of the unperturbed molecule, Fi is the field at the origin, μi, αij, βijk and γijkl are the components of dipole moment, polarizability, the first hyperpolarizabilities, and second hyperpolarizabilities, respectively.
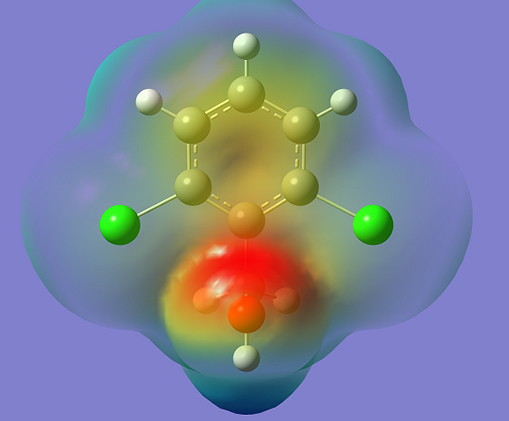
The calculated first hyperpolarizability of the title compound is 0.588×10⁻³⁰ esu which is 4.523 times that of standard NLO material urea (0.13 ×10⁻³⁰ esu) [27]. We conclude that the title compound is an attractive object for future studies of nonlinear optical properties. Molecular Electrostatic Potential (MEP) MEP is related to the Electron Density (ED) and is a very useful descriptor in understanding sites for electrophilic and nucleophilic reactions, as well as hydrogen bonding interactions [28]. The electrostatic potential V(r) is also well suited for analyzing processes based on the "recognition" of one molecule by another, as in drug-receptor and enzyme-substrate interactions, because it is through their potentials that the two species first "see" each other [29,30]. To predict reactive sites of electrophilic and nucleophilic attacks for the investigated molecule, MEP at the B3LYP/ 6-31G (6D, 7F) optimized geometry is calculated. The different values of the electrostatic potential at the surface are represented by different colors: red represents regions of most electronegative, electrostatic potential; blue represents regions of the most positive electrostatic potential; and green represents region of zero potential. Potential decreases in the order red < orange < yellow < green < blue. The MEP surface (Fig.4) provides necessary information about the reactive sites. From the MEP, it is evident that the negative region covers the CH2 group, oxygen atom, phenyl ring, and the positive region is over the hydrogen atoms.
Frontier Molecular Orbital Analysis The most widely used theory by chemists is the molecular orbital (MO) theory. It is important that ionization potential (I), electron affinity (A), electrophilicity index (ω), chemical potential (μ), electro-negativity (χ), and hardness (η) be put into a MO framework. Based on density functional descriptors, global chemical reactivity descriptors of compounds, such as hardness, chemical potential, softness, electro negativity, and electrophilicity index, as well as local reactivity, have been defined [31-33]. Pauling introduced the concept of electro-negativity as the power of an atom in a compound to attract electrons to it. Using Koopman’s theorem for closed shell components h, m and c can be defined as η = (I -A)/2; μ = -(I + A)/2; χ = (I + A)/2; where I and A are the ionization potential and electron affinity of the compounds, respectively. The ionization energy (I) and electron affinity (A) can be expressed through HOMO and LUMO orbital energies as I = -EHOMO = 8.086 and A = -ELUMO = 4.413eV. Electron affinity refers to the capability of ligand to accept precisely one electron from a donor. However, in many kinds of bonding viz. covalent hydrogen bonding, partial charge transfer takes place. Considering the chemical hardness (η), a large HOMO-LUMO energy gap means a hard molecule and a small HOMO-LUMO gap means a soft molecule.
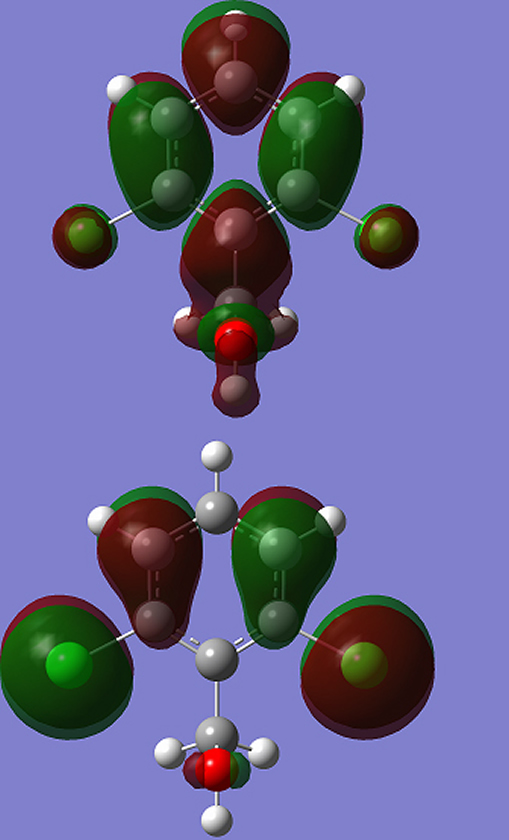
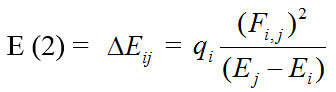
One can also relate the stability of the molecule to hardness, which means that the molecule with a smaller HOMO-LUMO gap (3.673eV) is more reactive. Parr et al. [31] have defined a new descriptor to quantify the global electrophilic power of the compound as electrophilicity index (ω) which defines a quantitative classification of global electrophilic nature of a compound. Parr et al. have proposed electrophilicity index (ω) as a measure of energy lowering due to maximal electron flow between donor and acceptor. They defined electrophilicity index as follows: ω = μ2/2η. The usefulness of this new reactivity measure has been recently demonstrated in understanding the toxicity of various pollutants in terms of their reactivity and site selectivity [34]. The calculated values of ω, μ, χ, and η are 10.6324eV, -6.250eV, 6.250eV, and 1.837eV, respectively. The calculated value of electrophilicity index describes the biological activity of the title compound. The atomic orbital components of the frontier molecular orbital are shown in Fig. 5. Natural Bond Orbital Analysis The natural bond orbital (NBO) calculations were performed using NBO 3.1 program [35] as implemented in the Gaussian09 package at the DFT/B3LYP/ 6-31G (6D, 7F) level in order to understand various second-order interactions between the filled orbital of one subsystem and the vacant orbital of another subsystem, which is a measure of the intermolecular delocalization or hyper-conjugation. NBO analysis provides the most accurate possible ‘natural Lewis structure’ picture of ‘j’ because all orbital details are mathematically chosen to include the highest possible percentage of the electron density. A useful aspect of the NBO method is that it gives information about interactions of both filled and virtual orbital spaces that could enhance the analysis of intra- and inter-molecular interactions. The second-order Fock-matrix was carried out to evaluate the donor–acceptor interactions in the NBO basis. The interactions resulted in a loss of occupancy from the localized NBO of the idealized Lewis structure into an empty non-Lewis orbital. For each donor (i) and acceptor (j) the stabilization energy (E2) associated with the delocalization i --> j is determined as:
qi is donor orbital occupancy, Ei, Ej is the diagonal elements, and F(i,j) is the off diagonal NBO Fock- matrix element. In NBO analysis large E(2) value shows the intensive interaction between electron-donors and electron- acceptors, and a higher extension of conjugation of the whole system. The possible intensive interaction is given in Table 2. The second-order perturbation theory analysis of Fock-matrix in NBO basis shows that strong intra-molecular, hyper-conjugative interactions are formed by orbital overlap between n(Cl) and π*(C-C) bond orbital which result in ICT causing stabilization of the system. These interactions are observed as an increase in electron density(ED) in C-C anti-bonding orbital that weakens the respective bonds. The strong intra-molecular, hyper-conjugative interaction of C3-C4 from Cl10 of n3(Cl10) --> π*(C3-C4) which increases ED(0.39326e) that weakens the respective bonds C3-C4 leading to stabilization of 9.63kJ/mol and also the hyper-conjugative interaction of C1-C2 from Cl11 of n3(Cl11) --> π*(C1-C2) which increases ED (0.37193e) that weakens the respective bonds C1-C2 leading to stabilization of 9.29kJ/mol.
The NBO analysis describes the bonding in terms of the natural hybrid orbital n3(Cl10), which occupies a higher energy orbital (-0.31889a.u) with considerable p-character (100%) and low occupation number (1.94196) and the other n1(Cl10) occupies a lower energy orbital (-0.92091a.u) with p-character (15.25%) and high occupation number (1.99411). The NBO analysis also describes the bonding in terms of the natural hybrid orbital n3(Cl11), which occupies a higher energy orbital (-0.31888a.u) with considerable p-character (100%) and low occupation number (1.94195) and the other n1(Cl11) occupies a lower energy orbital (-0.92090a.u) with p-character (15.25%) and high occupation number (1.99412). Again, the NBO analysis describes the bonding in terms of the natural hybrid orbital n2(O15), which occupies a higher energy orbital (-0.28535a.u) with considerable p-character (100%) and low occupation number (1.96816) and the other n1(O15) occupies a lower energy orbital (-0.60657a.u) with p-character (46.89%) and high occupation number (1.98601). Thus, a very close to pure p-type lone pair orbital participates in the electron donation to the π*(C3-C4) orbital for n3(Cl10)--> π*(C3-C4) and π*(C1-C2) orbital for n3(Cl11) --> π*(C1-C2) interaction in the compound. The results are tabulated in Table 3.
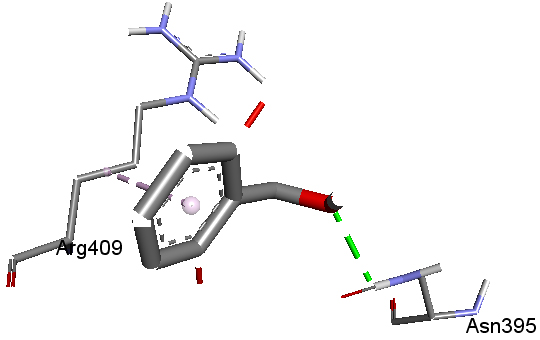
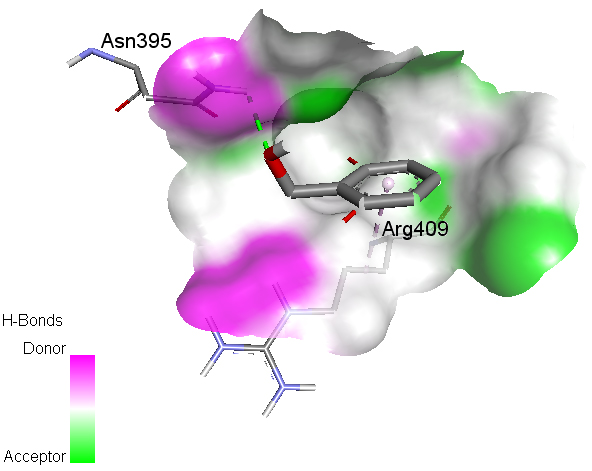
Molecular Docking Aryl hydrocarbon receptor (AHR), a cytosolic ligand-activated transcription factor, belongs to the family of hetero-dimeric transcriptional regulators and is widely expressed in a variety of animal and human species, and experimental animal data provided substantial support for an association between abnormal AHR function and cancer, implicating AHR may be a novel drug-interfering target for cancers [36]. Certain benzyl alcohol derivatives show anticancer activity [37]. High-resolution crystal structure of aryl hydrocarbon receptor was downloaded from the protein data bank website (PDB ID: 2B02). All molecular docking calculations were performed on AutoDock-Vinasoftware [38]. The 3D crystal structure of aryl hydrocarbon receptor was obtained from Protein Data Bank. The protein was prepared for docking by removing the co-crystallized ligands, waters, and co-factors. The AutoDockTools (ADT) graphical user interface was used to calculate Kollman charges and polar hydrogen. The ligand was prepared for docking by minimizing its energy at B3LYP/6-31G (6D, 7F) level of theory. Partial charges were calculated by Geistenger method. The active site of the enzyme was defined to include residues of the active site within the grid size of 40Å×40Å×40Å. The most popular algorithm available in Auto Dock, the Lamarckian Genetic Algorithm (LGA), was employed for docking. The docking protocol was tested by extracting co-crystallized inhibitor from the protein and then docking the same. The docking protocol predicted the same conformation as was present in the crystal structure with RMSD value well within the reliable range of 2Å [39]. Amongst the docked conformations, one which binds well at the active site was analyzed for detailed interactions in Discover Studio Visualizer 4.0 software. The ligand binds at the active site of the substrate (Figs. 6 and 7) by weak non-covalent interactions. Amino acid Asn395 forms H-bond with OH group and Arg409 forms hydrophobic interaction with phenyl ring. The docked ligand title compound forms a stable complex with aryl hydrocarbon receptor and gives a binding affinity (ΔG in kcal/mol) value of -4.4 (Table 4). These preliminary results suggest that the compound might exhibit inhibitory activity against aryl hydrocarbon receptor.
Conclusions The vibrational spectroscopic studies of 2,6-dichlorobenzyl alcohol were reported experimentally and theoretically. Potential energy distribution of normal modes of vibrations was done using GAR2PED program. Using HOMO and LUMO energy values, the quantum chemical descriptors are reported. MEP predicts the most reactive part in the molecule and it is evident that the negative region covers the CH2 group, oxygen atom, and phenyl ring, and the positive region is over the hydrogen atoms. The hyperpolarizability of the title compound 4.523 times that of standard NLO material urea and is an attractive object for future studies in nonlinear optics. From the molecular docking study title compound forms a stable complex with aryl hydrocarbon receptor and gives a binding affinity value of -4.4kcal/mol, and this suggests that the compound might exhibit inhibitory activity against aryl hydrocarbon receptor. Acknowledgements Authors, BH would like to thank UGC, India for a minor research project and RKS would like thank University of Kerala for a research fellowship. References
|
||||||||||||||||||||||||||||||||||||||||||||||||||||||||||||||||||||||||||||||||||||||||||||||||||||||||||||||||||||||||||||||||||||||||||||||||||||||||||||||||||||||||||||||||||||||||||||||||||||||||||||||||||||||||||||||||||||||||||||||||||||||||||||||||||||||||||||||||||||||||||||||||||||||||||||||||||||||||||||||||||||||||||||||||||||||||||||||||||||||||||||||||||||||||||||||||||||||||||||||||||||||||||||||||||||||||||||||||||||||||||||||||||||||||||||||||||||||||||||||||||||||||||||||||||||||||||||||||||||||||||||||||||||||||||||||||||||||||||||||||||||||||||||||||||||||||||||||||||||||||||||||||||||||||||||||||||||||||||||||||||||||||||||||||||||||||||||||||||||||||||||||||||||||||||||||||||||||||||||||||||||||||||||||||||||||||||||||||||||||||||||||||||||||||||||||||||