|
Introduction Cancer is a hyperplastic cellular malignancy predicted to affect 1,658,370 people (newly diagnosed cases) in the United States in 2015 alone. The top three most frequently diagnosed forms of cancer in men have historically been lung/bronchus, prostate, and colon/rectum [1]. Oncogenesis is associated with both genetic predisposition and environmental onslaught, with a mixture of the two being required for the malignancy to progress. Birindelli et al. [2] described cancer as "the result of circumvention of the apoptotic machinery, promotion of cell division and cell proliferation, loss of cell differentiation pathways, and disruption of cell-cell communication and interaction" [2]. The resulting disease state produces malignant tissue that invades and destroys nearby tissue and can metastasize to other areas of the body [3]. Cancer is aggressive, degenerative, and affects many people worldwide. There are predicted to be 589,430 cancer deaths in 2015 in the United States alone [1]. In 1999, there were an estimated 8,100,000 cases diagnosed worldwide in that single year [4]. Cancer is classified into three categories: sarcomas, affecting bone and fibrous tissue (muscle, blood vessels); carcinomas, affecting tissues such as the epithelium, lungs, breast, and colon; and leukemias and lymphomas, affecting the cells of the bone marrow and lymph nodes [5]. Tumor markers, circulating serum factors, are used in the diagnostic screening for cancer. Prostate cancer is a carcinoma involving the epithelial cells of the prostate, a gland in the lower abdomen of males, just below the bladder and in front of the rectum, wrapping around the urethra. It is normally about 1.5" (3.8 cm) in diameter and produces prostatic fluid (a thick fluid that is part of semen) while simultaneously acting as a valve to allow sperm and urine to flow in the correct direction. Masses of abnormally proliferating cells swell the size of the prostate in malignant conditions and, if they breach the fibrous membrane surrounding this organ, they can quickly circulate to other tissues to produce aggressive metastasis [6]. Prostate cancer most often metastasizes to the lymph nodes, pelvic bones and spine or vertebrae, axial skeleton and proximal long bones, lungs, liver, bladder, and rectum [3]. The incidence of prostate cancer in 2015 is predicted to be 220,800 in the United States [1]. Prostate cancer is the most common cancer diagnosed in North American men [4]. It also affects thousands more in other countries worldwide. Thus, the problem of prostate cancer is both widespread and significant. Of primary importance in the study of prostate cancer is the method of diagnosis. In addition to medical history, physical examination, and visual and tactile (such as a rectal examination) methods of tumor determination, an accurate screening test must be developed to increase early detection, efficacy of treatment, and survival rates. Alterations of genes associated with cancer provide products that can be used as molecular markers to indicate a cancer disease state [2]. Prostate specific antigen (PSA) is currently accepted as the most precise screening test for the detection of prostate cancer [7]. However, prostatic acid phosphatase was used for many years as "the most valuable enzyme marker for the diagnosis of prostate cancer," [7] because of its characteristic antigenic properties that are unlike other acid phosphatases [8]. Testosterone has also been theorized to have similar properties. In this study, all three markers (PSA, PAP, and testosterone) were assayed in patient samples, some of which were cancerous and others which were not. The number of false positives and negatives and true positives and negatives were calculated to determine the percent specificity and sensitivity of each test. The tests were then compared by these means to determine which was the most precise for the diagnosis of prostate cancer. The objective of this study was to compare the diagnostic efficacy of PAP with that of two other markers (PSA and testosterone). It was hypothesized that PAP would prove superior to PSA and testosterone for the diagnostic screening for prostate cancer. Materials & Methods The kits used in this project were purchased from Diagnostic Automation, Inc. (Calabasas, CA). Tests were performed using immunoassays for prostatic acid phosphatase and testosterone. Statistical analyses were performed using SPSS version 22 statistical software. The samples were tested for prostate specific antigen at the hospitals of their origin. Permission for this study was granted by the University of Southern Mississippi Institutional Review Board under the protocol number 11080903 in accordance with Federal Drug Administration regulations, the Department of Health and Human Services, and university guidelines to ensure adherence to stipulated criteria. Patient serum samples were obtained from two regional hospitals with only a patient number and the cancer diagnosis provided. Normal samples, obtained from a national medical center and a local regional hospital, were also utilized from persons not suspected of having cancer in order to provide a basis of comparison. All procedures detailing the confidentiality of patient medical records were followed and no information regarding the identification of a specific patient was released by the hospitals involved. Samples were collected by hospital personnel at the respective hospitals, allowed to clot, and centrifuged before being frozen and packaged in plastic tubes for transport. Before testing, all samples were sorted into test tube racks and allowed to reach room temperature. Patient samples were classified by the hospital pathologists as either cancerous or cancer free (Table 1). This diagnosis was only provided for comparison. One hundred two normal control samples (from males in good health) were tested without bias in order to generate a normal (healthy) interval for reference. Three test procedures were used in this experiment and consequently three sets of materials were required. Procedural instructions included with each kit were followed. The results of the assays performed in the laboratory were read with a Beckman Coulter AD 340 microplate reader. The washing of the micro-well solutions was done with a Stat Fax 2600 microplate washer. The assays performed at the provider hospitals were done with a Beckman Coulter Synchron LXI 725/Beckman Access process. Prostatic Acid Phosphatase Kit The kits, catalog #42272 and lot #12301054, used for this procedure came from Diagnostic Automation, Inc. The prostatic acid phosphatase (PAP) kit used is a quantitative solid phase enzyme linked immunosorbent assay with a detection range of 0-30 μg/mL. The test requires 50 μL of serum and performs to a specificity of 96% at a sensitivity of 1 μg/mL (as recorded by Diagnostic Automation, Inc.). The wells provided are coated with anti-PAP antibodies, and the enzyme conjugate is a mixture of anti-PAP antibodies chemically conjugated to horseradish peroxidase (HRP). The antibodies in the conjugate have different affinities toward epitopes of PAP molecules. The conjugate binds to the sample mixture in an amount proportional to the amount of PAP in the sample. Washing the solutions with the wash buffer removes any unbound conjugate. After addition of the 3,3',5,5'-tetramethylbenzidine (TMB) solution, the test mixture undergoes a light-sensitive colorimetric reaction accelerated by the HRP enzyme conjugate whose products are pigmented and allows a measurement of color intensity at 450 nm, which is proportional to the amount of bound enzyme conjugate and thus the concentration of PAP present [9]. In preparation for the assay, all reagents and samples were brought to room temperature (24±30C) and gently mixed. The wash buffer was prepared by adding 10 mL washing buffer concentrate into 990 mL distilled water. Blanks (deionized water), calibration solutions, and controls (calibration solution of 3 ng/mL was used as the control) were run in duplicate in the first 14 wells of each kit. The remaining wells contained serum samples or extra controls. The procedures were performed according to the manufacturer’s protocol (REF #4227Z) included in the purchase from Diagnostic Automation, Inc. Testosterone Kit The kits, catalog #RN-42074 and lot #RN-42010, used in this procedure came from Diagnostic Automation, Inc. The testosterone kit used is an enzyme immunoassay intended to quantitatively determine the concentration of testosterone in human serum. Diagnostic Automation, Inc. recorded its sensitivity to 0.05 ng/mL. This equals a concentration of 0.05 parts per billion (ppb), or 50 parts per trillion (ppt). The assay requires 10 μL of serum. Samples are dispensed into anti-rabbit IgG-coated wells and incubated with testosterone-HRP conjugate and rabbit anti-testosterone. The testosterone-HRP (fixed, known amount) competes with the testosterone in the sample to bind to the testosterone antibody (with a fixed number of binding sites). Unbound testosterone is washed away. Consequently, the detectable amount of testosterone-HRP bound to the wells decreases as the amount of testosterone in the sample increases. The 3,3',5,5'-tetramethylbenzidine (TMB) reagent added to the solution produces a colorimetric reaction which is then stopped by the addition of the stop solution (1N hydrochloric acid, HCl). The intensity of the color produced can be measured spectrophotometrically at 450 nm to determine the amount of enzyme bound to the wells, which has an inversely proportional relationship to the concentration of testosterone in the samples [10]. In preparation for the assay, all reagents and samples were brought to room temperature (24±30C) and gently mixed. References, controls, and serum samples were run in duplicate at the beginning of each procedure. The procedures were performed according to the manufacturer’s protocol (REF #2095) included in the purchase from Diagnostic Automation, Inc. Prostate-Specific Antigen Test This assay was performed in the hospital laboratories where the patient samples originated. The reagent kits came from Siemens Healthcare Diagnostics with the catalog name ADVIA Centaur Assay. This PSA assay procedure has been labeled a "two-site sandwich immunoassay" [11] because of its use of two antibodies that “sandwich” the antigen. Constant amounts of both antibodies are used. The first antibody (a polyclonal goat anti-PSA antibody) is labeled with acridium ester, while the second (a monoclonal mouse anti-PSA antibody) has been linked to paramagnetic particles. The combination of these antibodies with the antigen (PSA) leads to a chemiluminescent reaction that can be measured in relative light units (RLUs). The amount of RLUs expressed is in direct correlation with the amount of PSA present in the patient sample. This test requires 35μL of serum and is performed automatically by the ADVIA Centaur system. In preparation for the assay, all reagents and samples were brought to room temperature (24±30C) and gently mixed. The procedures were performed according to the manufacturer’s protocol (REF # 02676506) as purchased from ADVIA.
TABLE 1
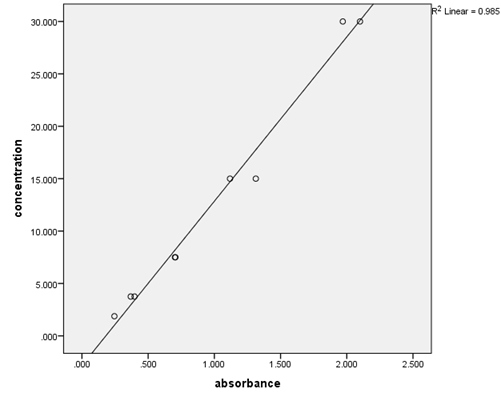
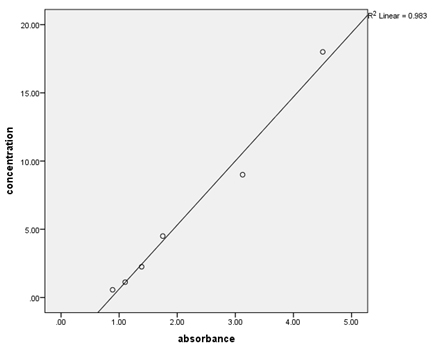
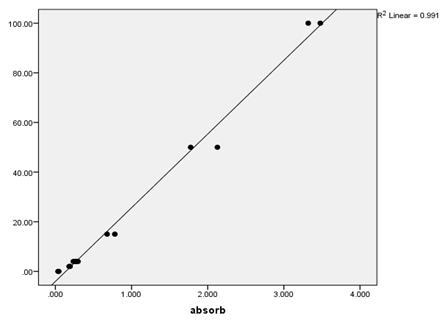
Results Over the course of the project, quality control samples were incorporated into the assays to determine within- and between-run precision (Table 2). For the PAP assays, the calibrators provided were used, and additionally the provided 3 ng/mL calibrator was used as a control. For the testosterone assays, the calibrators and controls provided (control 1=0.486-1.5 ng/mL, control 2=5.2-14.0 ng/mL) were utilized. The coefficient of variation (%CV) for PSA was low (2%), but those for PAP and testosterone (41.78% and 23.29%, 10.74%, respectively) varied. Serial dilutions of patient samples were used to determine the linearity of the assays (Table 3, Figures 1-3). These results indicate good linearity, with all R2 values near 0.98. The minimum concentration each assay is able to detect (assay sensitivity) was determined by analyzing 20 replicates of the diluent and calculating the mean ±2 standard deviation, which was established as the cut-off value (Table 4). Assay sensitivities ranged from 0.000-2.330 for testosterone. The normal reference intervals (NRI) are given in Table 5. The NRIs were obtained by assaying sera from approximately 100 healthy adult males and calculating the mean±2SD. The intervals obtained were increased over those given in the manufacturers’ inserts for the PAP assay. In determining the normal (negative) and abnormal (positive) patient results, cut-off values from the manufacturers’ inserts were used (Table 6). In this way, diagnostic sensitivities of 30.12% (PSA), 20.73% (PAP), and 0.00% (testosterone) were obtained. Sensitivities for combined markers were 30.12% (Testosterone and PSA), 43.37% (PAP and PSA), and 43.37% (testosterone, PAP, and PSA). Diagnostic sensitivity is the proportion of individuals with a disease who test positively with the test in question for that disease. The higher the sensitivity, the more accurate the test is. Similarly, diagnostic specificity is the proportion of individuals without the disease who test negatively with the test in question. Diagnostic specificities of 91.29% (PSA), 80.38% (PAP), and 96.80% (testosterone) were obtained. Combined specificities were 89.15% (testosterone and PSA), 75.11% (PAP and PSA), and 72.77% (testosterone, PAP, and PSA). Other diagnostic parameters evaluated were predictive value (+), which is the fraction of positive tests that are true positives, predictive value (-), which is the fraction of negative tests that are true negatives, and diagnostic efficiency, which is the fraction of all test results that are either true positives or true negatives.
Discussion Analytical parameters for each of the three testing methods were adequate. As previously stated, the normal reference intervals (NRIs) calculated for PAP were significantly higher than the manufacturer’s specifications. This was possibly due to a few falsely diagnosed subjects, an intrinsic defect with the testing procedure itself, or possibly a difference between the healthy sample population used to calculate the NRIs and our population due to a difference in geographical area and hence a difference in genetic mix. In an effort to test the possibility that there were one or more outliers that were causing our normal PAP results to be elevated compared with those cited by the manufacturer, we reran the data using the total sample of normal subjects (n = 101; X = 7.79; SD = 14.99), normal subjects with PAP values less than 40 ng/mL (n = 95; X = 4.80; SD = 8.68), normal subjects with PAP values less than 30 ng/mL (n = 91; X = 3.41; SD = 5.70), normal subjects with PAP values less than 20 (n = 87; X = 2.53; SD = 3.99), and normal subjects with PAP values less than 10 (n = 79; X = 1.49; SD =2.14). It was concluded that omitting 22 subjects (22%) from the normal/healthy subject pool failed to improve the SD to X ratio, but did improve the absolute NRI. From these data, it became clear that we have a non-homogeneous population of normal subjects and not simply one or two outliers. This could argue for an intrinsic defect in the testing procedure or a difference in the two populations of normal subjects. Since any adjustment of the cutoff points would inevitably affect both the diagnostic sensitivity and the diagnostic specificity, the decision was made to use the uncorrected diagnostic cutoff points provided by the manufacturers. None of the diagnostic sensitivities were optimal, but of the three examined, PSA remained the most precise by that measure. The diagnostic specificities obtained were more optimal, with testosterone representing the most specific assay (96.80%). This result was in great contrast to the 0% sensitivity of testosterone. The “cutoff points” for testosterone used were those of the manufacturer (uncorrected). PAP specificity (80.38%) was below either of the other tests (PSA-91.29%; testosterone-96%). Predictive values (+ and -) were similarly comparable. One notable result was the 0% PV+ of testosterone and its 84.70% PV- value. Consequently, it could be theorized that testosterone has more value in ruling out prostate cancer than in confirming it. PAP stayed consistently second or third in the comparison of diagnostic parameters. Testosterone had the highest diagnostic efficiency (82.40%), followed closely by PSA (81.73%). Lee et al. [8] stated “Serum prostatic acid phosphatase has been reported as the most valuable enzyme marker for the diagnostic screening for prostate cancer.” More recently however, Haese et al. [7] wrote, based on further testing, that “most experts now agree that PAP analysis has no role in the diagnosis and monitoring of prostate cancer and that PSA is clearly the superior marker.” These results confirm those of our tests. While PSA does not have the ideal hallmarks of a tumor marker (high sensitivity and specificity, PV+ and -, and efficiency), it is comparably the best available within the spectrum of this study. Neither of the other markers assayed demonstrated as much consistent diagnostic screening precision as PSA. The initial statement by Lee et al. [8] that PAP is the most valuable marker was most likely made before the major discovery of the assay for PSA was widely known (Dr. Richard Albin work). Conversely, Haythorn and Albin [12] have recently stated that the current PSA screening method is misused, leads to unnecessary treatment and anxiety and does not lead to a reduction in patient mortality. They suggest that current methods should be applied with discrimination until a replacement test can be identified. Although PAP is still used in some cases to monitor cancer progression and detect tumors that do not produce a sizable increase in PSA concentration, it has largely been replaced by PSA due to evidence reported by Haese et al. [7] and others. These latter reports are in agreement with the findings of this study. References
|
||||||||||||||||||||||||||||||||||||||||||||||||||||||||||||||||||||||||||||||||||||||||||||||||||||||||||||||||||||||||||||||||||||||||||||||||||||||||||||||||||||||||||||||||||||||||||||||||||||||||||||||||||||||||||||||||||||||||||||||||||||||||||||||||||||||||||||||||||||||||||||||||||||||||||||||||||||||||||||||||||