|
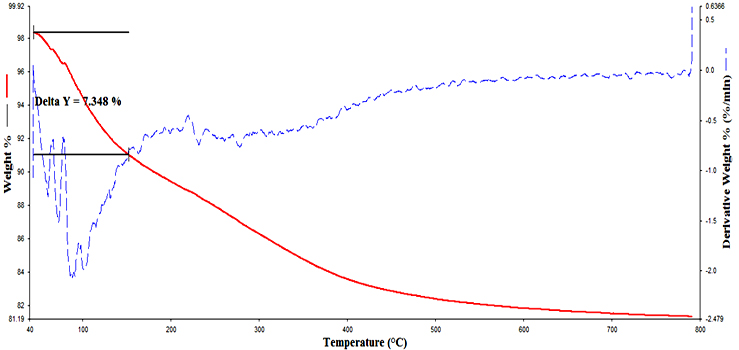
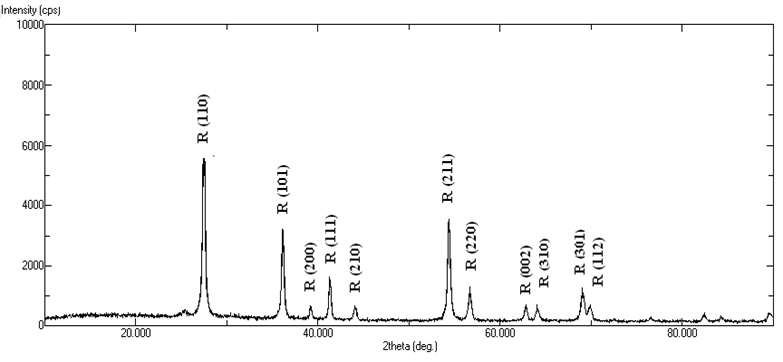
Introduction Titanium dioxide (TiO2) is a functional material for several technological applications strongly related to its crystalline structure and morphology [1-6]. In the previous era, the main applications of TiO2 were in the areas of pigments, catalysts and supports, fine ceramics, cosmetics, etc. After the first synthesis of nano TiO2, its applications are tremendous and being explored in the new area of material science, including that of smart materials. For the last nearly two decades, the main applications of TiO2 are in the field of organic electronics such as sensors, semiconductor in opto-electronic devices, including dye sensitized solar cells [7-9]. Nano TiO2 is also being used in inorganic membranes and environmental purification systems [10-14]. The applications of nano TiO2 are mainly due to its high chemical stability, good photo activity, wide band-gap, relatively low cost and non-toxicity. Crystalline TiO2 has three main polymorphs, e.g. anatase, rutile and brookite, from these rutile is thermodynamically stable phase [15]. Rutile, anatase and brookite have the same fundamental structural octahedral units with different arrangements [16]. Anatase and brookite phases are metastable and readily transformed to rutile phase when heated. Conventionally, the optical band-gap of rutile titania is 3.00eV. Therefore, theoretically it is supposed to absorb in the near UV region compared with the anatase phase. In some reports, it has been shown that rutile phase could have a higher activity over anatase when it has smaller crystallite size [17]. Rutile TiO2 has some advantages over anatase phase, such as higher refractive index, higher dielectric constant, higher electric resistance and higher chemical stability [18]. Rutile TiO2 has been used as the main white pigment in paints and cosmetic products and also used in capacitor, filter, power circuits and temperature compensating condensers [12]. Wang et al. reported the high photocatalytic activity of rutile TiO2 for decomposition of rhodamine –B in water under artificial solar light irradiation [19]. Park et al. showed that the photovoltaic characteristics of rutile TiO2 based dye sensitized solar cells are comparable to those of anatase TiO2 based solar cells [20, 21]. Rutile TiO2 nanoparticles can be obtained via high temperature calcination of anatase nanoparticles. However, calcination unavoidably leads to agglomeration and growth of the nanocrystalline particles [22, 23]. Hydrolysis of TiCl4 in aqueous solution can form rutile nanocrystals at relatively low temperatures [24]. These methods are easily affected by the pH value and autoclaving temperature and cannot be controlled easily. Therefore the synthesis of rutile TiO2 nanocrystals by one step method at room temperature would be significant. Many techniques have been developed to synthesize mesoporous titania using facile template methods such as chemical implantation [25], sol- precipitation methods [26] and hydrothermal synthesis [27]. One of the most widely used solution based nanoparticle synthesis is the sol-gel process which involves evolution of an inorganic network, known as a sol, from certain precursor materials and the consequent gelation of this inorganic network to form an ordered, three-dimensional net structure, and then the destruction of the evolved gel resulting in the formation of nanocrystalline material. The sol-gel route is very attractive because it is relatively easy to perform and allows us to tailor the morphology of particles by relative rate of hydrolysis and condensation reactions [28]. In the present work, mesoporous rutile nano titania was synthesized by an ultrasound assisted sol-gel method without any surfactant. In recent years, ultrasonic irradiation has attracted great interest because it can produce the extreme conditions and lead to the formation of the novel structures. The sonochemical effects of ultrasound arise from acoustic cavitation, i.e., the formation, growth and implosive collapse of bubble generates localized hot spots through shockwave formation within the gas phase of the collapsing bubble. Sonochemistry is a promising preparation method that may resolve the problems arising from the conventional synthesis methods and also, this method can save energy and time, thus reducing the cost of final products. The synthesis is rapid and reproducible. Many sonochemical methods have already been established for the preparation of titanium dioxide nanoparticles. Gedanken and colleagues reported the preparation of mesoporous titania by sonication of ethanol/ water solution containing titanium tetra isopropoxide and structure directing agent dodecylamine under ambient conditions for 6 hours [29]. Wang and co-workers have synthesized rutile titania nanocrystal by the hydrolysis of TiCl4 in the presence of water and ethanol under ultrasonic irradiation at 700C for 3 hours [30]. Amir and colleagues reported mixture of rutile and anatase nano crystal titania by sonochemical method by the hydrolysis of titanium tetra isopropoxide in ethanol using sodium hydroxide and deionised water at 500C for 1.5 hours [31]. Hernandez-Perez and co-workers reported sonochemical synthesis of anatase tiatania nanocrystal using titanium butoxide in acetone and methanol [32]. The present method differs from the existing methods that mesoporous rutile titania nanoparticles synthesized from isopropanol without addition of surfactant and it is a room temperature reaction completed within 30 minutes. The present work describes the synthesis of mesoporous rutile titania nanoparticles with spherical morphology by ultrasound assisted sol-gel method. The synthesis was carried out in isopropanol using titanium tetra isopropoxide as the titanium precursor and HCl is used as the acid. The method is simple, efficient and requires low temperature. Experimental Materials Titanium tetra isopropoxide (TIP) (Merck), isopropyl alcohol (Merck) and hydrochloric acid (Merck) have been used in the synthesis of nanocrystalline titania particles. All the reagents used were of analytical grade and no further purification was done before use. Methods In a preparation procedure, 2mL of titanium tetra isopropoxide was first dissolved in 20mL isopropyl alcohol by sonication for 10 minutes using high intensity ultrasonic probe (Vibronics, Ti horn, 200V) immersed directly in the reaction solution. To this solution a mixture of 1mL HCl in 9mL distilled water is added and again sonicated for 30 minutes. The clear sol formed immediately converted to a gel. The gel was then dried in the oven at 800C overnight to evaporate the organic materials to the maximum extent. The dried crystals were calcined at 5000C for 2 hours. Thermal decomposition nature of the sample was investigated by thermogravimetric analyzer, Perkin Elmer-TGA 4000, under nitrogen atmosphere at a heating rate of 200C/min. X-ray diffraction analysis patterns for the phase analysis were obtained with a Rigaku Miniflex II diffractometer, using Cu-Kα radiation. The morphology of the sample was characterized by scanning electron microscope using JEOL 5600 SL microscope. N2 adsorption- desorption measurements were done on a volumetric micrometrics tristar apparatus at liquid N2 temperature (77.35K). The sample was treated at 3000C before measurement. On an average 33 points were taken for the sample and the average mass of the sample was 0.3g. Pore size distributions were calculated using the Barrett-Joyner-Halenda method and surface area were calculated from the adsorption isotherm by the Brunauer-Emmett-Teller method. The average pore size was calculated from the t-plot method. Infrared spectra were measured on a Shimadzu FT-IR 8400 S spectrometer as potassium bromide disc. Results & Discussion Thermo Gravimetric Analysis (TGA) Figure 1 shows the thermogram of synthesized titania sample before calcination. The degradation has occurred in a single step. This weight loss is due to desorption of physisorbed water and alcohol on the external surface of the crystallites. The initial weight loss is started at 500C and is attributed to the loss of alcohol and water from the surface and the mass loss is 7.348%. There is no separate identified weight loss. However, there is a constant degradation up to 5000C. Above 5000C till 8000C, an essentially constant mass (81% sample) has been found indicating the thermal stability of the sample. X-ray Diffraction Analysis (XRD) Figure 2 shows the XRD patterns of calcined titania particles. The 2Θ values are observed at 270, 360, 390, 410, 440, 540, 560, 620, 640 and 690, which are in terms with the JCPDS Card Files, No. 77-0441. These peaks confirm the formation of rutile phase of titania. Based on this XRD values, the crystallite size and phase percentage of anatase and rutile can be determined [33]. The crystallite size (D) can be calculated by the Scherrer formula [34] as expressed in Eq. (1): D = kλ (1) / β cosθ Where D is the crystallite size, λ is the wavelength of X- ray radiation, k is a constant taken as 0.89, β is the line width at half maximum height (FWHM) of the peak and θ is the diffraction angle. The crystallite size of the titania from the present sol-gel study found to be 27.7 nm.
Scanning Electron Microscopy (SEM) Scanning electron microscopy (SEM) of the nanocrystalline TiO2 was carried out to estimate the surface morphology. XRD and SEM together give the exact knowledge about the particle size and characteristics of the synthesized sample. Figure 3 shows the SEM image of the synthesized sample. As shown in the graph, the titania particle is composed of very tiny spherical nanoparticles. From the SEM image, the grain size of the nanoparticle is seen and in XRD, the crystallite size is observed. From the SEM image, titania nanoparticles with non-uniform grain size are observed.
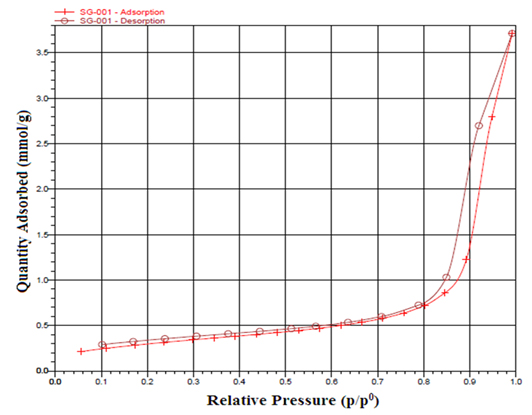
Brunauer-Emmett-Teller (BET) Analysis BET surface area measurements were also made on the TiO2 nanoparticle. Figure 4 shows the N2 adsorption-desorption, which is close to type IV of the IUPAC classification with an evident hysteresis loop suggesting the sample is mesoporous. This hysteresis is an H3 type hysteresis loop in the relative pressure range (p/p0) 0.7-1.0. Type H3 usually found on solids with a very wide distribution of pore size.
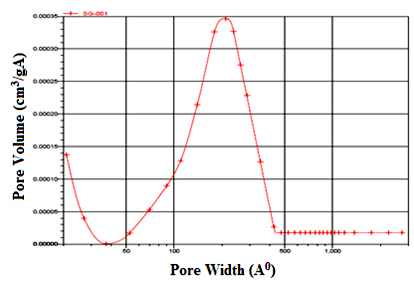
As shown in Figure 4, the capillary cohesion of TiO2 occurred at the highest pressure, suggesting that the sample TiO2 had the large pore size and the H3 hysteresis loop also suggested the sample had a wide pore size distribution and slit-shaped pores [35]. The specific surface area of the sample calculated by the BET method is 24.33m2g-1. The pore size distribution is shown in Figure 5. The size of the most of the pores concentrate between 5 to 40nm with an average pore size of 21.1nm estimated with BJH method. The BET surface area and the pore volume were determined to be 24.33m2/g and 0.128cm3/g, respectively.
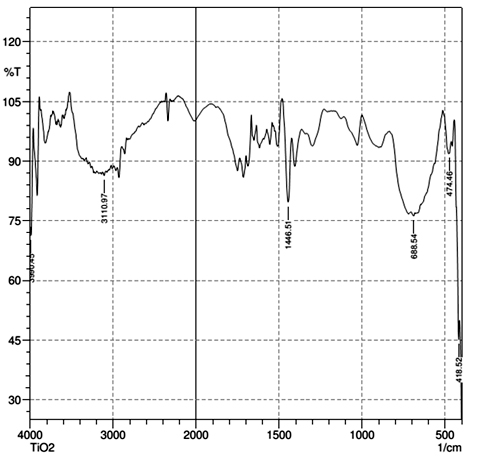
Fourier Transform Infrared Spectroscopy (FT-IR)
FT-IR spectrum of synthesized titania sample after calcination is shown in Figure 6. The characteristic peaks are observed at 3110, 1446, 688, 474 and 418cm-1. Even after the calcinations, the presence of water is observed (peak at 3110cm-1, which corresponds to O-H stretching vibration and peak at 1446cm-1, corresponds to O-H bend vibration of water). The Ti-O vibrations are observed at peaks 688cm-1, 474cm-1 and 418cm-1 [36]. Conclusions Pure spherical rutile titania nanoparticles were successfully synthesized using simple and cost effective sol-gel technique by ultrasonic irradiation. Ultrasonic irradiation reduced the sol-gel reaction time. The TGA analysis confirms the thermal stability of titania nanoparticles. Nearly 81% remained after 5000C. XRD shows the formation of high-purity rutile titania nanoparticles and the size is 27.7nm. Surface morphological studies obtained from SEM micrograph showed that the particles with the spherical shape. Mesoporous structure of the synthesized titania nanoparticle confirmed by BET analysis. The mesoporous titania nanomaterials could have a wide range of potential applications in catalysis and optoelectronics. Acknowledgement One of the authors (Swapna M.V.) acknowledges the Council of Scientific and Industrial Research (CSIR), New Delhi, India, for the financial support. References
|
||||||||||||||||||||||||