|
|
|
|
| The Chemist Volume 88 | Number 1 |
 
|
|
| |
Public Understanding of Chemistry - The STEM Workforce: An Occupational Overview
|
| |
Public Understanding of Chemistry: Chemistry and its social-political-economic context continue to change.
Chemistry and chemistry-based technology that impact our lives make for the complexity and controversy of life and set the stage for thinking about public understanding of chemistry. The Public Understanding of Chemistry section will try to address chemistry in real life context with original contributions (articles/position papers/policy briefs) and/or published articles and columns in reputable sources (used with permission).
Founding Section Editor: David Devraj Kumar, Section Co-Editor: David M. Manuta
Acknowledgement: Reprinted with permission from the Dept. of Professional Employees, AFL-CIO.
|
About AFL-CIO (DPE): The Department for Professional Employees, AFL-CIO (DPE) comprises 22 AFL-CIO unions representing over four million people working in professional and technical occupations. DPE-affiliated unions represent: teachers, college professors, and school administrators; library workers; nurses, doctors, and other health care professionals; engineers, scientists, and IT workers; journalists and writers, broadcast technicians and communications specialists; performing and visual artists; professional athletes; professional firefighters; psychologists, social workers, and many others. DPE was chartered by the AFL-CIO in 1977 in recognition of the rapidly growing professional and technical occupations.
Key Words: STEM, Workforce, DPE. |
|
|
Introduction
Professionals in science, technology, engineering, and mathematics (STEM) fields stand at the forefront of innovation in the U.S. economy. As technological changes reshape the world of work, these professionals are consistently in demand. However, some STEM occupations are struggling, especially in the natural and social sciences. This fact sheet will outline the employment and earning trends in STEM occupations; unionization in STEM fields; the location of STEM jobs; gender, race, and ethnicity in STEM; and the challenges offshoring and U.S. guest worker visa programs pose for U.S. STEM workers.
Employment and Unemployment in STEM Occupations
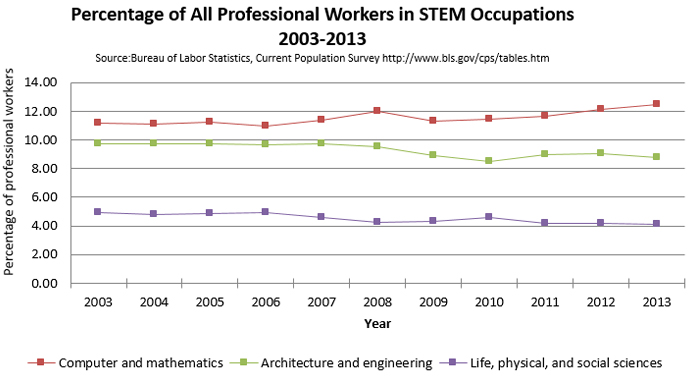
In 2013, computer and mathematical occupations employed 3,816,000 workers, while there were 2,846,000 workers employed in architecture and engineering occupations and 1,316,000 in life, physical, and social science occupations. Together they accounted for 25.4 percent of the professional labor force and 5.6 percent of the total U.S. workforce [1].
Computer and mathematical-related occupations are driving growth among STEM occupations. From 2003 to 2013, computer and mathematical-related occupations accounted for 98.7 percent of job growth in STEM occupations. From 2003 to 2013, architecture and engineering occupations added just 79,000 jobs and life, physical, and social science occupations lost 68,000 jobs [2]. At the same time, computer and mathematical occupations added 858,000 jobs.
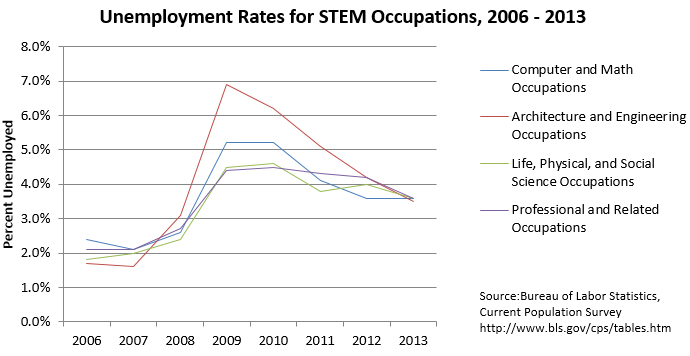
Unemployment rates for STEM workers remains below the national average, but is in line with the unemployment rate for all professional and related workers [3]. As the chart below shows, STEM unemployment rates have not returned to their pre-recession levels.
Employment growth within the STEM field varies dramatically by occupation. From 2003-2013:
- Employment of computer programmers declined by 13.1 percent;
- Employment of aerospace engineers grew by 75.6 percent;
- Employment of electrical and electronics engineers decreased 17.4 percent;
- The number of drafters decreased by over 44 percent;
- Among the natural sciences, the number of biologists saw no change and chemists and materials scientists decreased 13.6 percent; and
- Medical scientists saw strong growth, increasing 42.6 percent and adding 43,000 jobs [4].
Recovery from the 2008 downturn started to take hold, in many STEM occupations, in 2010.
- Employment in professional and related occupations increased 3.6 percent from 2010 to 2013.
- Computer and mathematical occupations grew by 12.7 percent from 2010-2013. Nearly half of the growth was among mathematical occupations and computer support specialists.
- Architecture and engineering occupations added 187,000 jobs between 2010 and 2013, growing 7.1 percent. However, between 2008 and 2010, over 300,000 architecture and engineering jobs were shed.
- Life, physical, and social science occupations have clearly struggled to recover. Although the unemployment rate for life, physical, and social science occupations is similar to other STEM occupations, in the last four years these occupations have shed 102,000 jobs and total employment has declined by 7.2 percent [5].
Mean Annual Earnings in 2012
Professionals in STEM occupations typically have higher average salaries than other workers. A U.S. Department of Commerce study found that STEM jobs generally enjoy a wage premium over non-STEM jobs, reporting that those employed in the former earn 26 percent more than those employed in the latter. However, this premium diminishes when controlling for level of educational attainment [6].
Mean annual earnings in 2012 were generally higher for STEM jobs than other professional or related occupations; however, within each STEM field there was wide variation [7].
- In computer and mathematical jobs the mean annual wage was $80,180 in 2012; computer and information research scientists were at the top end of the wage range ($103,670) while computer support specialists earned a mean of $50,130 or $62,960 depending on the type of computer support provided (user or network).
- Mean annual earnings for engineers in 2012, ranged from $79,760 for industrial engineers at the low end of the pay scale to $147,470 for petroleum engineers at the high end of the pay scale. Engineering technicians earned a mean annual salary of between $49,220 for civil engineering technicians and $61,980 for aerospace engineering and operations technicians.
- Life, physical, and social scientists had the lowest mean annual earnings of the three STEM sectors ($68,360 in 2012). Generally, scientists earned more than the mean annual average (between $65,000 and $103,000). However, technician earnings were below average with agriculture and food science technicians earning just $36,390 in 2012 and nuclear technicians at the high end of the scale earning a mean annual wage of $69,720 in 2012 [8].
Education Attainment
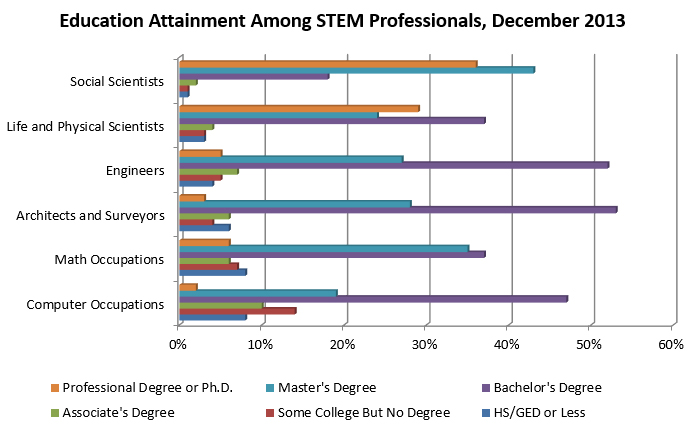
Education attainment in STEM occupations was high in December 2013. Among all STEM occupations, 72 percent of workers held a bachelor’s degree or higher. Life, physical, and social scientists had the highest education attainment with 96 percent of social scientists and 91 percent of life and physical scientists having earned at least a bachelor’s degree in December 2013 [9].
In December 2013, among technical occupations, the education attainment was lower, which reflects the skills needed to perform the work. Most drafters and technicians had completed schooling beyond a high school diploma. Among drafters, 55 percent had completed an associate’s degree in December 2013. Life, physical, and social science techs had high education attainment, with 52 percent having completed an associate’s degree or higher in December 2013 [10].
STEM Graduation Rates
The supply of new STEM graduates is robust. In academic year 2011-12, 141,000 bachelor’s degrees were conferred to graduates in natural sciences and mathematics and 146,000 bachelor’s degrees were awarded to students in computer sciences and engineering. Also in academic year 2011-12, 26,000 master’s degrees were awarded in natural sciences and mathematics and 66,000 degrees were awarded in computer sciences and engineering. Nearly 25,000 doctor’s degrees were awarded to students in natural sciences, mathematics, computer sciences, and engineering in academic year 2011-12 [11].
Union Membership and the Union Advantage
Union members generally have higher wages, better benefits, and more stable working conditions. In 2013, 16.7 percent of professional and related workers were members of unions [12]. STEM occupations generally had a lower rate of unionization.
- In 2013, 10 percent of professionals employed in life, physical, or social science related occupations were union members; 7.3 percent of professionals in architecture and engineering occupations were union members; and 4.3 percent of professionals in computer and mathematical occupation were union members [13].
- In 2013, psychologists (30.2 percent) and conservation scientists and foresters (23.3 percent) had the highest rate of union membership among those in life, physical, and social science occupations. Among engineers, environmental engineers (23.8 percent) and marine engineers (14.5 percent) reported the highest rates. In computer and mathematical fields, actuaries (11.1 percent) and operations research analysts (8.5 percent) had the highest rates of unionization [14].
- In 2012, unionization had a strong effect on wages for lower-paid STEM workers. Among engineering technicians other than drafters, unionized workers earned an average of $31.46 an hour, compared to an average hourly wage of $23.72 for non-unionized workers. Similarly, for computer support specialists, unionized workers earned $29.49 an hour compared to $25.79 an hour for non-unionized workers [15].
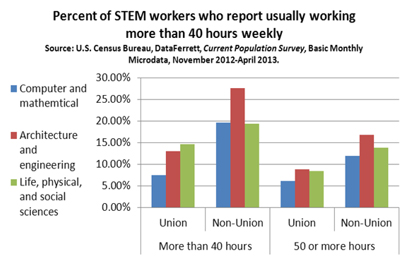 Median weekly wages for full-time and salaried workers in life, physical, and social science fields were higher in 2013 for unionized ($1,233) than non-unionized ($1,149) employees 16]. Median weekly wages for full-time and salaried workers in life, physical, and social science fields were higher in 2013 for unionized ($1,233) than non-unionized ($1,149) employees 16]. - While computer and mathematical and architecture and engineering occupations generally report higher wages amongst non-union workers, there is evidence to suggest unionized workers enjoy an hourly premium. From November 2012 to April 2013, 12 percent of unionized workers reported they usually work more than 40 hours per week, compared to 19 percent for non-unionized STEM workers [17].
Location Matters in STEM Employment
There are regional differences in the number of STEM field occupations available. In 2011, STEM jobs made up 5.2 percent of the total workforce nationwide. Across states, this ranged from a low of 2.8 percent in Mississippi to 10.1 percent in Washington, D.C. Population density and local industry influence the number and type of jobs available in a given area. Often, regions with federal research or contracting installations tend to have a larger number of people employed in STEM occupations [18].
- California has more than 13 percent of the U.S. STEM workforce (just over one million jobs). However, it lost 19,000 STEM jobs in the last decade (a 1.75 percent decline). Los Angeles County has the largest number of STEM jobs in the U.S. (more than 235,000).
- Washington, D.C. has more than two times the concentration of STEM jobs than the national average. Fairfax and Arlington counties —counties interconnected to D.C.’s economy— have helped Virginia expand its presence of STEM-related workers, on a per-capita basis, more than any other state in the last decade. Washington State, Seattle in particular, experienced the second fastest growth.
- The two counties in the U.S. with the most STEM workers per capita — Los Alamos, New Mexico, and Butte, Idaho — are home to major Department of Energy national laboratories [19].
Women, Black, and Hispanic Workers in STEM: Underpaid and Underrepresented
In STEM, there is under-representation of women and minorities; these workers are often concentrated in lower-paying technical occupations [20].
- While women made up 57.1 percent of all professional workers in 2013, they only comprised 46.1 percent of science professionals, 26.1 percent of computer and math professionals, and 14.1 percent of engineering and architecture professionals [21].
• Women’s participation in computer and mathematics and life, physical, and social science occupations decreased from 2003–2013. However, women maintained the same concentration in architecture and engineering occupations from 2003 – 2013 [22].
- In 2013, medical and biological sciences represented women more proportionately than other STEM occupations where they were 52.4 percent and 52.7 percent, respectively, of all workers. However, they accounted for only 27.9 percent of environmental scientists. In psychology there was an over representation of women; almost three in four psychologists were women, yet median weekly earnings for women was $1,178 while the average for men and women was $1,267 (the average just for men was not available). Thus, male psychologists earned at least seven percent more than their female colleagues in 2013 [23].
- In every STEM occupation for which there is available data, the median weekly earnings for women were 11-25 percent lower than they were for men in 2012 [24].
- On average, men employed in professional and related occupations earned 27 percent more than women in 2013 [25].
- Black professionals represented 9.3 percent of the professional workforce and Hispanic professionals only 8.2 percent. Hispanic workers were 15.6 percent of the labor force in 2013 and Black workers comprised 11.2 percent of the labor force [26].
- In computer and mathematical occupations, 8.3 percent of workers were Black or African American, 6.3 were Hispanic or Latino, but 18.5 percent were Asian. Asians were just 8.3 percent of the professional workforce in 2013 [27].
- In the life, physical, and social sciences, Black professionals were under-represented, making up 5.6 percent of the workforce, and in architecture and engineering occupations, Black professionals were just 5.5 percent of the workforce in 2013 [28].
- Workers of Hispanic origin comprised 7.5 percent of the architecture and engineering field and 7.9 percent of life, physical, and social scientists [29].
- Black professionals were more proportionally represented in relatively lower-paying support or technician positions. They held 8.3 percent of engineering technician positions in 2013 and represented 13.2 percent of computer support personnel [30].
- Hispanic workers were also more proportionally represented in technician and technologist occupations, at 13 percent of engineering technicians and 10 percent of miscellaneous life, physical, and social science technicians in 2013. Among scientists, the highest proportion of Hispanics worked in chemistry and material science (12.3 percent) [31].
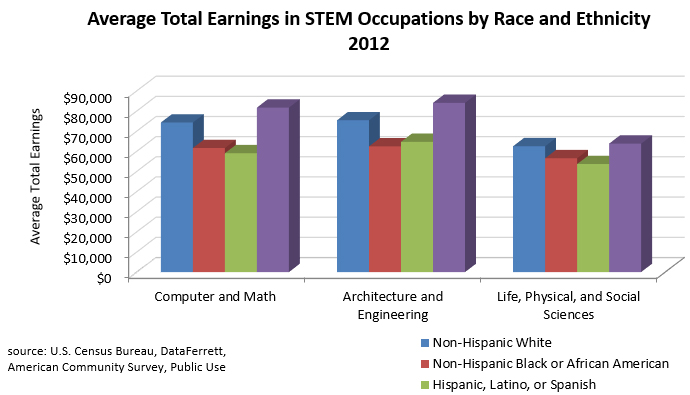
Asians reported the highest average earnings in each of the three STEM occupation sectors. Non-Hispanic Whites also had above average earnings, while Black and Hispanic or Latino professionals earned below average wages in 2012 [32].
When income data from technician occupations were removed from the earning averages, Black and Hispanic or Latino STEM professionals still earned thousands of dollars less than White and Asian STEM professionals in 2012 [33].
Offshoring and Immigration Policy Challenges U.S. STEM Workers
The U.S. government makes available an array of skilled worker visas, including the H-1B, L, O, E3, and TN to employers seeking guest workers. In just FY 2012, nearly 470,000 guest worker visas were issued to employers for categories H-1B, L-1, optional practical training, O, TN (NAFTA professional), and E3 workers (Australian professionals) [34].
- Although skilled guest workers make up a very small percentage of the overall U.S. workforce, they are disproportionately concentrated in STEM industries. Among all STEM workers, 10.2 percent were not U.S. citizens in February 2014, (over 800,000 workers). In computer and mathematical occupations, 12.4 percent of workers were not citizens. In life, physical, and social science occupations, 10.4 percent were not U.S. citizens. Among architects and engineers, 6.8 percent of the workforce was not U.S. citizens [35].
- Tech industry lobbyists often claim that the visas make it possible to bring in the “best and brightest” workers to combat shortages of U.S. workers in STEM industries. Yet, there is no labor market test to ensure that unscrupulous employers do not replace U.S. professionals with temporary guest workers. According to the Alfred P. Sloan Foundation, “no one who has come to the question with an open mind has been able to find any objective data suggesting general ‘shortages’ of scientists and engineers.” [36] Labor market indicators do not demonstrate a supply shortage and the evidence suggesting a need for more H-1B workers is anecdotal [37]. Further, as Harold Salzman of the Urban Institute points out, “the United States’ education system produces a supply of qualified [science and engineering] graduates in much greater numbers than the jobs available.” [38] Estimates indicate that close to 50 percent of STEM graduates in the U.S. are not hired in STEM-related fields, suggesting the claims of a shortage in STEM is largely rhetorical and not supported by the data [39].
- Despite the provisions stating that H-1B visa beneficiaries must receive the prevailing wage, guest workers generally make less than their U.S. counterparts. As far back as 2001, the National Research Council of the National Academy of Sciences and the National Academy of Engineering warned the “size of the H-1B workforce relative to the overall number of IT professionals is large enough to keep wages from rising as fast as might be expected in a tight labor market.” [40] The Academy’s warning bears true in current wage data.
- From 2005 to 2012, the median hourly earnings for operations research analysts increased from $32.84 to $38.31. After adjusting for inflation this represents a one percent decrease in buying power [41].
- Similarly, for computer programmers, the median hourly wage increased from $30.49 in 2005 to $35.71 in 2012, which, after adjusting for inflation, represents no increase in buying power [42].
- A 2009 study from the Council on Foreign Relations shows that H-1B admissions at current levels are associated with about a five to six percent drop in wages for computer programmers and systems analysts [43].
- In 2011, Georgetown University’s Center on Education and the Workforce reported that engineering wages grew more slowly over the last three decades than any other occupational category, only 18 percent [44].
- The Department for Professional Employees, AFL-CIO supports comprehensive immigration reform to combat this trend, especially the creation of an independent commission that would ensure foreign and domestic workers fair access to jobs and protection from employer abuse. For more information on guest worker programs and professional and technical workers, see DPE’s 2012 publication “Gaming the System” (http://dpeaflcio.org/wp-content/uploads/Gaming-the-System-2012-Revised.pdf). For more information on professional and technical workers, check DPE’s website: www.dpeaflcio.org.
References
- U.S. Department of Labor, Bureau of Labor Statistics, Current Population Survey, 2012, Annual Averages, Table 11. http://www.bls.gov/cps/cpsaat11.htm
- U.S. Department of Labor, Bureau of Labor Statistics, Current Population Survey, 2003-2013, Annual Averages, http://www.bls.gov/cps/tables.htm#annual
- Ibid.
- Ibid.
- Ibid.
- U.S. Department of Commerce. “STEM: Good Jobs Now and for the Future,” supra note 11.
- U.S. Department of Labor, Bureau of Labor Statistics, Current Population Survey, 2011, Table 39. http://www.bls.gov/cps/cpsaat39.htm
- U.S. Department of Labor, Bureau of Labor Statistics, Occupational Employment Statistics, Occupational Employment and Wages, May 2012. http://www.bls.gov/oes/current/oes_stru.htm
- U.S. Census Bureau, DataFerrett, Current Population Survey, Basic Monthly Microdata, December 2013.
- Ibid.
- National Center for Education Statistics, Digest of Education Statistics, Table 318.20 Bachelor’s, master’s, and doctor’s degrees conferred by postsecondary institutions, by field of study: Selected years, 1970-71-2011-12. Available at: http://nces.ed.gov/programs/digest/2013menu_tables.asp
- U.S. Department of Labor, Bureau of Labor Statistics, Current Population Survey, Annual Averages, 2012, Table 42. http://www.bls.gov/cps/cpsaat42.pdf
- U.S. Department of Labor, Bureau of Labor Statistics, Current Population Survey, Annual Averages, 2012, Table 42.
- Hirsch BT, Macpherson DA, Union Membership and Coverage Database from the CPS. 2013. Table V. Occupation: Union Membership, Coverage, Density, and Employment by Occupation, 1983-2013. Available at http://www.unionstats.com/
- Hirsch BT, Macpherson DA, Union Membership and Earnings Data Book: Compilations from the Current Population Survey (2013 Edition). Bloomberg BNA.
- U.S. Department of Labor, Bureau of Labor Statistics, Current Population Survey, 2013, Table 43.
- “U.S. Census Bureau, DataFerrett, Current Population Survey, Basic Monthly Microdata, November 2012-April 2013.
- Wright J. “States with Largest Presence of STEM-Related Jobs,” NewGeography, September 30, 2012. http://www.newgeography.com/content/002463-states-with-largest-presence-stem-related-jobs
- Ibid.
- U.S. Department of Labor, Bureau of Labor Statistics, Current Population Survey, 2010, Table 39.
- U.S. Department of Labor, Bureau of Labor Statistics, Current Population Survey, Annual Average 2013, Table 11.
- U.S. Department of Labor, Bureau of Labor Statistics, Current Population Survey, Household Data Annual Average 2003 and 2013, Table 11.
- U.S. Department of Labor, Bureau of Labor Statistics, Current Population Survey, Household Data Annual Average 2013, Table 39.
- U.S. Department of Labor, Bureau of Labor Statistics, Current Population Survey, Household Data Annual Average 2012, Table 39.
- U.S. Department of Labor, Bureau of Labor Statistics, Current Population Survey, Household Data Annual Average 2013, Table 39.
- U.S. Department of Labor, Bureau of Labor Statistics, Current Population Survey, Household Data Annual Average 2013, Table 11.
- Ibid.
- Ibid.
- Ibid.
- Ibid.
- Ibid.
- U.S. Census Bureau, DataFerrett, American Community Survey, Public Use Microdata, 2012.
- Ibid.
- U.S. Department of Homeland Security, USCIS, Characteristics of H1B Specialty Occupation Workers FY 2012; U.S. Department of State, Bureau of Consular Affairs, Report of the Visa Office 2012, Table XVI(B) Nonimmigrant Visas Issued by Classification (Including Crewlist Visa and Border Crossing Cards, Fiscal Years 2008-2012; U.S. Government Accountability Office, Student and Exchange Visitor Program: DHS Needs to Assess Risks and Strengthen Oversight of Foreign Students with Employment Authorization, March 7, 2014.
- U.S. Census Bureau, DataFerrett, Current Population Survey, Basic Monthly Microdata, February 2014.
- Teitelbaum M. Untitled Testimony. Subcommittee on Technology and Innovation of the Committee on Science and Technology U.S. House of Representatives. Washington. Nov. 6, 2007. Testimony. 1. Web. March 7, 2012. http://science.house.gov/sites/republicans.science.house.gov/files/documents/hearings/110607_teitelbaum.pdf
- Lowell BL, Salzman H. The Urban Institute. Into the Eye of the Storm: Assessing the Evidence on Science and Engineering Education, Quality, and Workforce Demand. The Urban Institute, 2007.
- Globalization of R&D and Innovation: Implications for U.S. STEM Workforce and Policy, 110th Congress, 2007.
- Salzman H, Kuehn D, Lowell BL. “Guestworkers in the High-Skill U.S. Labor Market: An analysis of supply, employment, and wage trends,” Economic Policy Institute, Washington, D.C., April 2013.
- National Research Council. Building a Workforce for the Information Economy. Washington: National Academy, 2001, 187.
- U.S. Department of Labor, Bureau of Labor Statistics, Occupational Employment Statistics, Occupational Employment and Wages, May 2005, May 2012.
- Ibid.
- Tambe P, Hitt L, Council on Foreign Relations. H-1B Visas, Offshoring, and the Wages of U.S. Technology Workers, working paper. CFR, April 14, 2009.
- Carnevale AP., Smith N, Melton M. Georgetown University, Center on Education and the Workforce. STEM. Washington: Georgetown University, 2011.
|