
|
Introduction For over two decades now, Cenospheres, which are lightweight, inert, hollow spheres, comprised largely of silica and alumina and filled with air and/or gases, have been used in a wide variety of products, including insulations, fire and heat protection devices, sports equipment, and automobile bodies. Due to their special characteristics, they are primarily used as high-quality, lightweight fillers. Their physical properties, particularly low density (due to hollow structure) and low thermal conductivity among others have made Cenospheres popular as fillers for polymer compositions for insulation products in the electrical industry [1]. Cenospheres are finding increasing use as substitutes for traditional fillers in sectors as diverse as ceramics, plastics, construction, recreation, automotive, energy and technology. Their use in preparing a fire-retardant coating for building materials has been reported [2]. Use of Cenospheres as reinforcing fillers in the preparation of HDPE lightweight composites has recently been reported [3]. Cenospheres have been in use for more than twenty years for improving the properties of a variety of finished consumer products. First introduced as an extender for plastic compounds (as they are compatible with plastisols, thermoplastics, latex, polyesters, epoxies, phenolic resins, and urethanes), their compatibility with specialty cements and other building materials, such as coatings and composites, was also quickly identified. Since then, Cenospheres have been used in many fields [2]. Cenospheres are formed as a by-product of coal-burning power plants [4]. When pulverized coal is burned at power plants, fly ash is produced. Cenospheres are the lighter particles that are contained within the fly ash. Typically, they have a particle size range of 10 - 600 microns [5]. The composition of Cenospheres is: SiO2 - 53%, Al2O3 - 38%, CaO - 3.6%, K2O - 1.5%, Fe2O3 - 1.3%, TiO2 - 1.3%, MgO - 0.7%, P2O5 - 0.4%, Na2O - 0.1%, Mn2O3 - 0.1% [5]. The main application of Cenospheres has been as inert fillers. The objective of the present work is to study the influence of Cenospheres on the thermal behavior and flame-retardant low-smoke (FRLS) and mechanical properties of PVC-based compositions. Experimental The common chemicals used for the study are purchased locally (AR grade) and are used without further purification. Composite materials such as PVC and Martinal (high-grade) are also purchased and used as such. Cenospheres are obtained from the local plant of CPRI, Bangalore, India. The PVC resin was first compounded (mixed) with Cenospheres as filler at filler concentrations of 0, 6, 12, 18 and 24 parts per hundred parts of resin (phr) (Table 1). The compounding was carried out in a Brabender Plasticorder (PLE 331) at 20 - 30 rpm for about 30 minutes. The torque developed was 4 - 7 N-m. The mixing temperature was 180 °C. After compounding, the compounded polymer-filler mixes were made into sheet specimens using Hot Press Tester (Labtech Co. Ltd., Seoul, Korea) maintained at a temperature of 175 °C and pressure of 90 kg/cm2. The sheet specimens obtained were used for determining various properties. The samples were subjected to thermal studies at various heating rates using Thermogravimetric Analyzer (Perkin Elmer TGA7 Model) and the data are as given in Table 2.
Results & Discussion Energetics of the reaction Using different heating rates, a series of curves (shown in the Figure 1) are recorded, the 5% loss temperatures and 5% loss temperatures shifting to lower values with reduced scan rate. The temperatures at 5% weight loss, as noted in Table 2, are used to calculate the E value using the following equation [6]-[8]:
This equation is in the form of y = c + mx. Thus, slope (m) = (– 0.457 E/R) (1 / 103) Knowing the slope, the activation energy, E, is calculated. 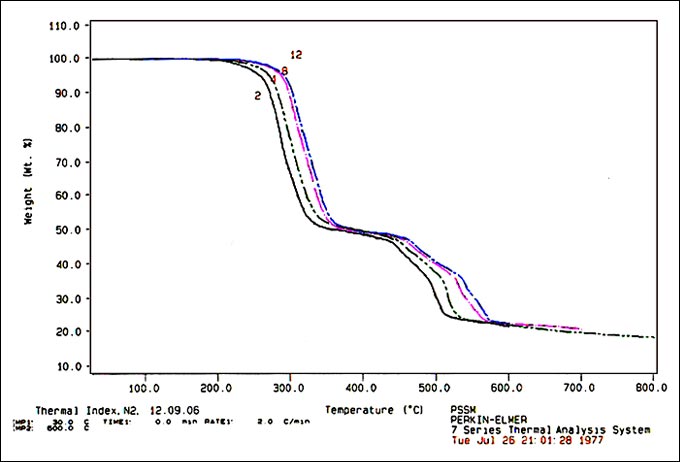 Figure 1. Representative TGA Curves Evaluation of thermal rating Reports on the application of thermal analysis for estimation of thermal life of wire enamels from the decomposition reactions are available in literature [7], [9]-[11]. The mathematical expression based on life theory and thermogravimetric theory is given by Toop [7]:
Because of the simplicity and reliability, this approach is generally preferred for determining thermal rating where thermal degradation is the result of simple chemical reaction [12]. The E and the corresponding θ values are given in Table 3.
Glass transition temperature studies The glass transition temperature can be defined as the temperature at which the forces holding the distinct components of an amorphous solid together are overcome by thermally induced motions within the time-scale of the experiment, so that these components become able to undergo large-scale molecular motions on this time-scale, limited mainly by the inherent resistance of each component to such flow [13]. The practical effects of the glass transition on the processing and performance characteristics of polymers are implicit in this definition [14]. The standard Tg value for PVC from literature is 75 – 82 0C [15]. For a few compositions, the Tg values were measured using the thermo mechanical analyzer (TA Instruments: TMA Q400 Model). See Table 4.
Effect on properties The Smoke Density Rating values were measured in accordance with ASTM D 2843 – 99. The lower the SDR value, the better. The Limiting Oxygen Index refers to the minimum amount of oxygen that is required to just support flaming combustion in a flowing mixture of oxygen and nitrogen and is expressed as volume percent. The higher the LOI value, the better. The LOI test was performed as per the standard test method ASTM D 2863 – 00. The T.S. values and % elongation-at-break were determined under standard laboratory conditions in accordance with ASTM D 412. See Table 5.
Conclusion The possibility of Cenospheres as fillers for PVC-based compositions is explored. In the filler concentration range studied, the 5% and 10% loss temperatures somewhat increase with the filler concentration. The activation energy for decomposition of the compound decreases in presence of Cenospheres, the magnitude of this decrease being maximum at 6 phr of filler and becoming progressively less pronounced at higher filler concentrations. A similar trend is noted for thermal rating values as well. The Tg value decreases in presence of Cenospheres, again the decrease being maximum at the lowest concentration studied. Lower Tg would mean increased polymer flexibility. The SDR data indicate that the optimal filler concentration may lie in the 18 - 24 phr interval. The LOI values above 30% are acceptable. Decrease in SDR without much affecting LOI values and thermal stability is noteworthy. The mechanical properties seem to be sufficiently preserved, though percentage elongation-at-break needs to be improved. It appears that there is a critical concentration of the filler content where desired improvements in thermal and FRLS properties become optimal, the advantage being lost if concentration is increased or decreased. More detailed studies are necessary to determine the most appropriate value for Cenospheres concentration for obtaining required levels of change in thermal behavior and other properties of the compositions. Acknowledgement The authors gratefully acknowledge the support from Central Power Research Institute (CPRI), Bangalore. References
Notes:
|
||||||||||||||||||||||||||||||||||||||||||||||||||||||||||||||||||||||||||||||||||||||||||||||||||||||||||||||||||||||||||||||||||||||||||||||||||||||||||||||||||||||||||||||||||||||||||||||||||||||||||||||||||||||||||||||||||||||||||||||||||||||||||||||||||||||||||||||||||||||||||||||||||||||||||||||||||||||||||||||||||||||||||||||||||||||||||||||||